
Image
|
Figure Caption
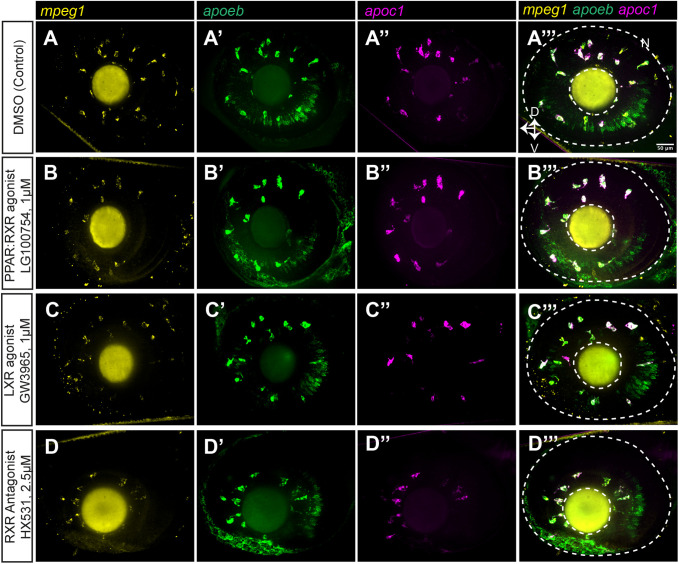
Fig. 7.
Expression of apoc1 and apoeb measured in individual microglia in the zebrafish eye/retina by HCR WISH following PPAR, LXR, and RXR modulation. We performed HCR wholemount in situ hybridization (WISH) with probe sets to detect mpeg1, apoc1, and apoeb in embryos following treatment with the indicated compounds. Orientation and regions of imaging are as indicated previously for Fig. 4. (A–D) Single channel and merged images from eye/retina for each treatment group. Orientation markers: D, dorsal; N, nasal; V, ventral. Images are representative of n=3–5 embryos per condition.
Acknowledgments
This image is the copyrighted work of the attributed author or publisher, and
ZFIN has permission only to display this image to its users.
Additional permissions should be obtained from the applicable author or publisher of the image.
Full text @ Biol. Open