
|
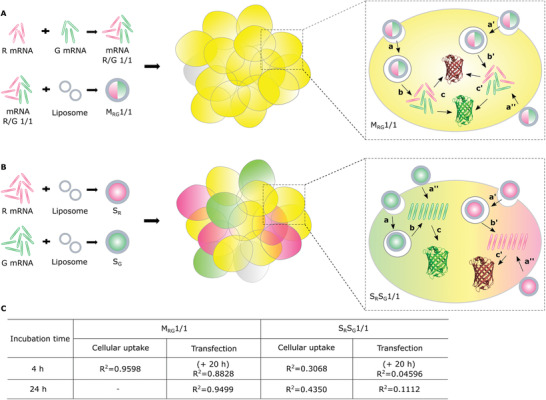
Figure 6 Schematic illustration of A) mRNA mingle-lipoplexes and B) mRNA single-lipoplexes at an R/G ratio of 1/1 that are being applied onto cells. (a, a’) mRNA lipoplexes are internalized into cells through endocytosis or (a’’) cell membrane fusion, (b, b’) the internalized lipoplexes escape from endosomal compartments, releasing free mRNA into the cytosol of cells, (c, c’) cytosolic mRNA can be translated leading to the target protein expression. C) Correlation derived from the flow cytometry dot plots of HeLa cells that were respectively applied with MRG1/1 and SRSG1/1. For cellular uptake, mRNA lipoplexes were incubated with cells for 4 and 24 h, while for transfection, mRNA-lipoplexes were incubated with cells for 4 h + 20 h and 24 h, respectively.