
|
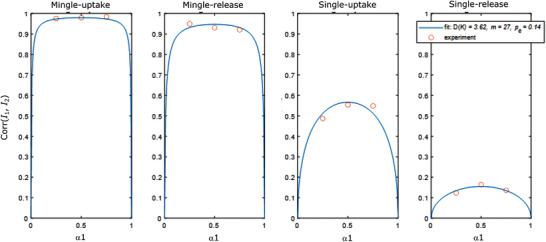
Figure 4 Simultaneous best fit (blue solid line) of the 4 correlation functions to the experimental correlation values (red circles) with D(K), pe and m as global fitting parameters. From left to right the four considered conditions are displayed in order of decreasing correlation: cargo uptake delivered by mingle-lipoplexes, cytosolically released cargo from mingle-lipoplexes, cargo uptake by single-lipoplexes and cytosolically released cargo from single-lipoplexes. Per condition the three considered cargo amounts are included: α1 = 0.25, 0.5, and 0.75 (corresponding to α1 = 0.75, 0.5, and 0.25, respectively)