IMAGE

Fig. 1

ID
ZDB-IMAGE-220207-1
Source
Figures for Yu et al., 2021
Image
Figure Caption

Fig. 1

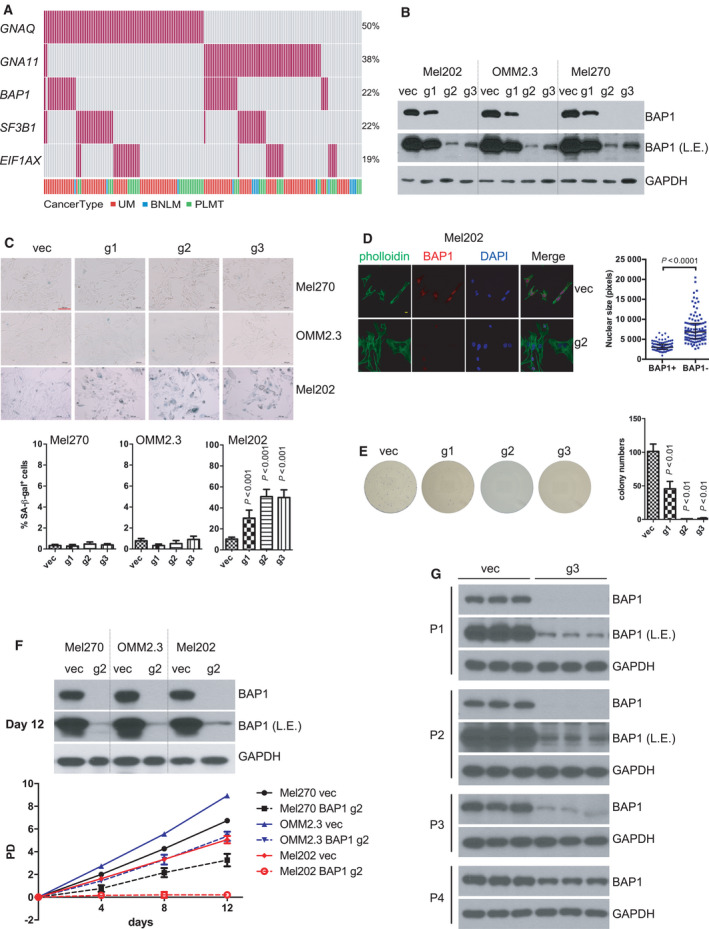
BRCA1‐associated protein 1 (BAP1) deficiency in UM cells with mutant splicing factor 3B subunit 1 (SF3B1) induces senescent phenotype. (A) Oncoprint depicting the five genes that are frequently mutated in UM across three studies, including the TCGA uveal melanoma (UM) dataset [4] downloaded from cBioportal [58], the exome sequencing UM dataset [8] and targeted amplicon‐based next‐generation sequencing UM dataset [14], blue nevus‐like melanoma (BNLM) [12, 13] and primary leptomeningeal melanocytic tumor (PLMT) [14]. Each bar in a column represents one patient, and each red bar represents the presence of the specified mutation. Data are from 179 patients. P values for mutual exclusivity of the paired gene mutations were derived from Fisher’s exact test. (B) Immunoblots show the knockout (KO) efficiency of three different BAP1‐targeting sgRNAs by lentivirus CRISPR‐Cas9. L.E. represents a longer exposure of BAP1 immunoblot. The blots shown are representative of three independent experiments. (C) Images show senescence‐associated β‐galactosidase staining in UM cells after BAP1 KO. G1, g2, g3 represent the three different sgRNAs used in panel B. The scale bar represents 100 μm. Graph represents the percentage of β‐galactosidase‐positive cells versus total cells (at least 200 cells were counted in random fields per group). The data are presented as the mean ± SD (n = 3) from one representative experiment out of three. One‐way ANOVA followed by Tukey test was used for statistical analysis. (D) Representative images for nuclear size of Mel202 cells. Immunofluorescence staining was performed for F‐actin (green, phalloidin), BAP1 (red), and DNA (blue, 4’,6‐diamidino‐2‐phenylindole). The scale bar represents 5 μm. Quantification of nuclear size of BAP1‐proficient and BAP1‐deficient Mel202. The data are presented as the median with interquartile range (at least 100 cells were counted in random fields per group) from one representative experiment (n = 3) out of three. The Mann–Whitney U‐test was used for statistical analysis. (E) Colony‐formation assay of Mel202 cells infected by vector control (vec) or BAP1‐targeting sgRNAs (g1, g2, and g3), and the colonies were stained with crystal violet for quantification. The data are presented as the mean ± SD (n = 3) from one representative experiment out of three. One‐way ANOVA followed by Tukey test was used for statistical analysis. (F) Population doublings (PD) of Mel270, OMM2.3, and Mel202 cells infected by vector control (vec) or BAP1‐targeting g2 sgRNA followed over 12 days. Immunoblots show the BAP1 protein level to confirm the BAP1 KO efficiency in the respective cell pool at the final time point (12 days). The data are presented as the mean ± SD (n = 3) from one representative experiment out of three. (G) Immunoblots show the BAP1 expression recovery during cell passages in Mel202 cells infected by BAP1‐targeting g3 sgRNA. The blots shown are representative of three independent experiments.

Acknowledgments
This image is the copyrighted work of the attributed author or publisher, and ZFIN has permission only to display this image to its users. Additional permissions should be obtained from the applicable author or publisher of the image. Full text @ Mol. Oncol.