
|
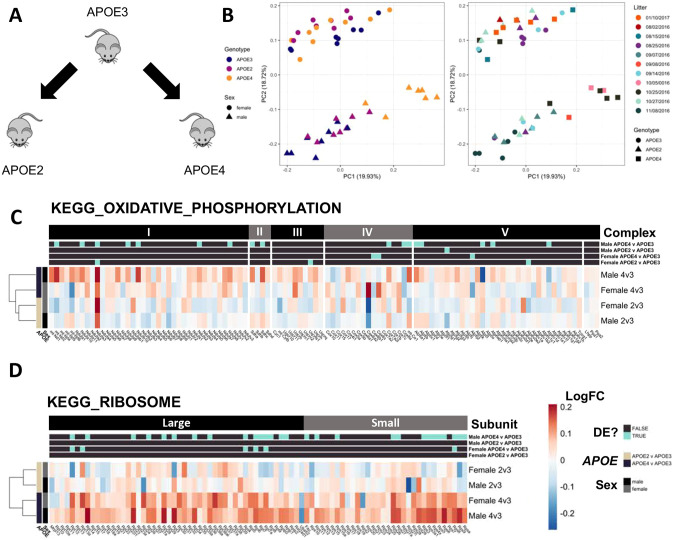
Fig. 3. RNA-seq analysis of 3-month-old APOE-TR mice. (A) Visual representation of the comparison of APOE4 (n=7 males and 9 females) or APOE2 (n=8 males and 8 females) mice to APOE3 (n=8 males and 8 females). This comparison was made for both male and female mice separately. (B) PCA of 3-month-old APOE-TR mice. Principal component 1 (PC1) is plotted against PC2. The numbers in parentheses indicate the percentage of variation in the dataset explained by a principal component. In the left graph, each point represents a sample, which are coloured by APOE genotype and shaped by sex. In the right plot, each point is coloured according to litter (implied from the date of birth of each mouse), and shaped by APOE genotype. (C,D) Heatmap showing the log fold change (logFC) of genes in the KEGG_OXIDATIVE_PHOSPHORYLATION (C) and KEGG_RIBOSOME (D) gene sets in APOE-TR mice. Rows are clustered based on their Euclidean distance, and columns are grouped by the complex in the electron transport chain to which an encoded protein belongs (C), or whether an encoded protein forms part of the large or small ribosomal subunits (D). Genes are labelled in blue above if they were classified as differentially expressed (DE, FDR<0.05) in the differential gene expression analysis in the listed comparisons.