
|
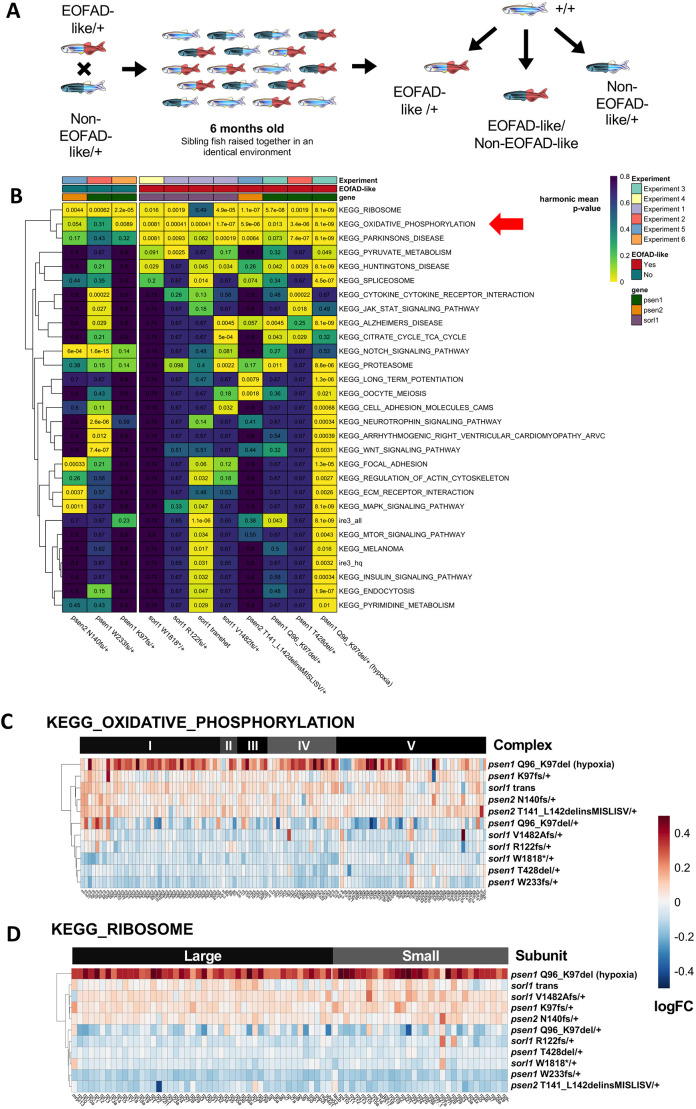
Fig. 1. RNA-seq analysis of 6-month-old zebrafish models of EOFAD. (A) Schematic of an RNA-seq experiment using zebrafish. A single mating of a single pair of fish heterozygous for either an EOFAD-like or a non-EOFAD-like mutation results in a family heterozygous mutant, transheterozygous mutant and wild-type siblings. Comparisons made between genotypes in an RNA-seq experiment are depicted. (B) Heatmap summary of significantly altered KEGG and IRE gene sets in zebrafish EOFAD genetic models at 6 months of age. Only gene sets significantly altered (FDR-adjusted harmonic mean P<0.05) in at least two comparisons of mutant zebrafish to their corresponding wild-type siblings are shown. Columns are grouped by whether or not the zebrafish genotype is EOFAD-like, and rows are clustered based on their Euclidean distance. The numbers are FDR-adjusted harmonic mean P-values. (C,D) Heatmap indicating the log fold change (logFC) of genes in the KEGG gene sets for oxidative phosphorylation (C) and the ribosome (D) in zebrafish mutants compared to their wild-type siblings. Rows are clustered based on their Euclidean distance, and columns are grouped by the complex in the electron transport chain to which an encoded protein belongs (C), or whether an encoded protein forms part of the large or small ribosomal subunits (D). Only genes considered detectable in all RNA-seq experiments are depicted. See Figs S1-Table 1 for more information on individual study designs.