
|
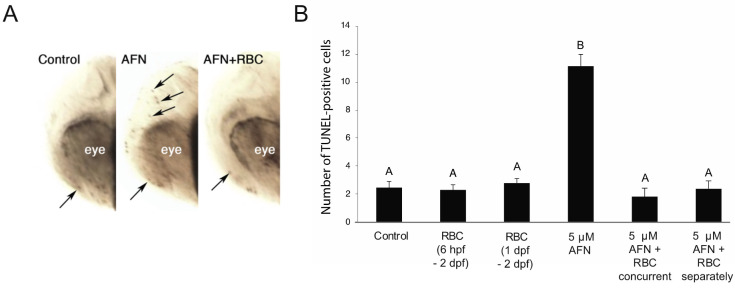
Figure 3 AFN exposure results in apoptosis and rescued by RBC. (A) Images of TUNEL-stained apoptotic cells in the head of embryos at 24 hpf (lateral view) in untreated controls (left) and 5 µM AFN-treated (middle) and RBC + AFN concurrently treated (right) embryos. Arrows indicate TUNEL-positive cells. (B) Number of TUNEL-positive cells in the head of 48 hpf embryos. Treatment groups: untreated controls, RBC (500 µM) exposure starting at 6 hpf, RBC (500 µM) exposure starting at 1 dpf, 5 µM AFN, 5 µM AFN with concurrent RBC exposure (6 hpf–5 dpf) and 5 µM AFN with separate RBC exposure (1 dpf–5 dpf). Error bars are standard error of the mean. Mean is the average of two biological replicates with n = 10 embryos in each treatment group. Data not sharing the same letter are statistically significantly different (p < 0.01) as assessed by one-way ANOVA, Tukey post-hoc analysis. Auranofin, AFN; Riboceine, RBC; hours post fertilization, hpf; days post fertilization, dpf.