
|
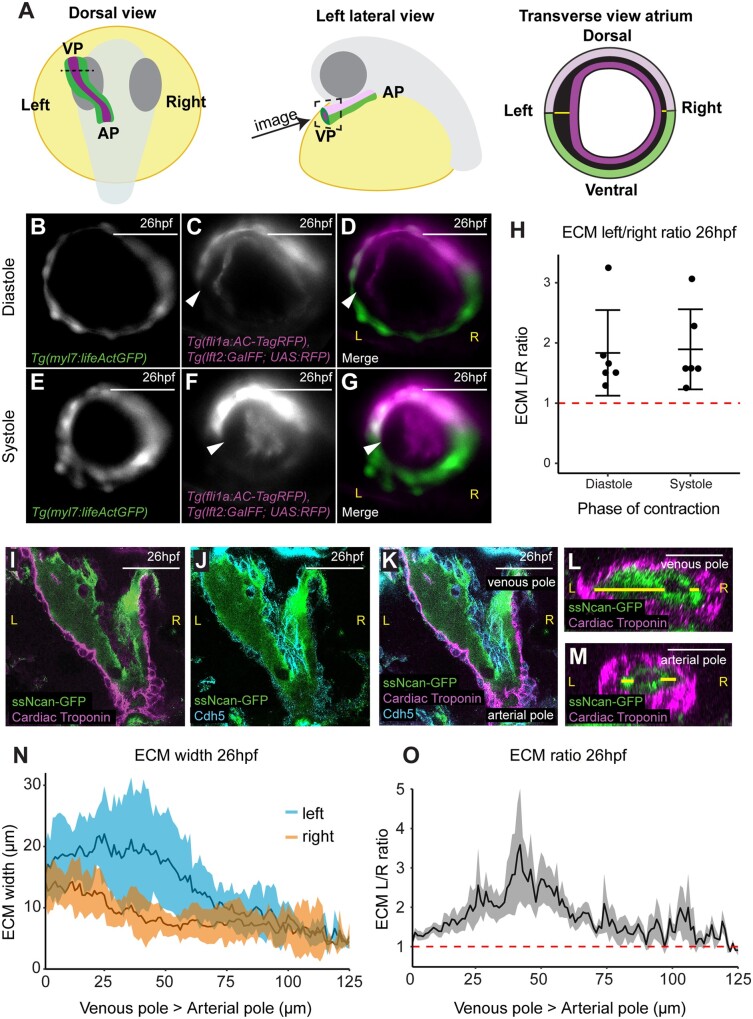
Figure 1 The hyaluronan-rich ECM is asymmetric during early zebrafish heart development. (A) Schematic depicting the developmental stage and orientation of zebrafish embryos used in live imaging experiments. Optical transverse sections of the heart tube are imaged at the position of the dotted line/dotted square. Green, myocardium; magenta, endocardium; light pink, dorsal myocardium. (B–G) Light-sheet optical cross-sections through the heart tube of a 26hpf Tg(myl7:lifeActGFP); Tg(fli1a:AC-TagRFP); Tg(lft2BAC:Gal4FF); Tg(UAS:RFP) transgenic embryo during diastole (B–D) and systole (E–G) at the level of the dotted line in (A). The myocardium is marked in green (B, D, E, and G), and the dorsal myocardium and endocardium are marked in magenta (C, D, F, and G). The extracellular space between myocardium and endocardium is expanded on the left side of the heart tube (white arrowhead). Scale bar = 50 μm. (H) Quantification of left–right ECM ratio in heart tubes, >1 (red dotted line) denotes left-sided expansion. Mean ± SD are plotted, n = 6. (I–K) Single confocal z-planes longitudinally through the heart at 26hpf of embryos injected with ssNcan-GFP (green), counterstained with cardiac troponin (magenta, I, K) and VE-Cadherin (cyan J, K). (L and M) Transverse optical reslice through the heart tube the venous pole (L) or arterial pole (M). ECM width is measured using the ssNcan-GFP signal (yellow line) on left and right sides of the tube. (N) Quantification of ECM width on the left (blue) and right (orange) sides of the heart tube from venous pole to arterial pole at 26hpf. Mean ± SD are plotted, n = 7. (O) Left–right ECM ratio in the heart tube from venous pole to arterial pole, where >1 (red dotted line) indicates a left-sided expansion. Mean ± SEM are plotted, n = 7. The mean L/R ratio across the heart is 1.667, and analysis using a one-sample t-test shows this significantly differs from 1, P < 0.0001 L, left; R, right; VP, venous pole; AP, arterial pole. Scale bar = 50μm.