
|
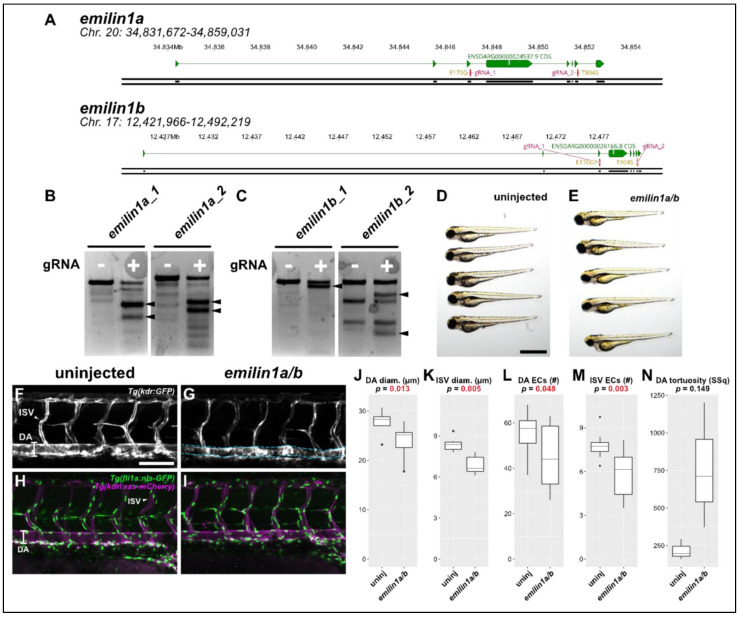
Figure 5
Knocking out emilin1a/b reduces DA and ISV diameter, endothelial cell counts. (A) Genomic region of chromosomes 20 and 17 containing emilin1a and b, respectively. Patient mutations E170G and T904S are indicated and their corresponding gRNAs are overlaid (magenta). (B) T7 endonuclease activity against gRNA target amplicons for emilin1a. Supernumerary bands are generated for both injected gRNAs (filled arrowheads). (C) Similar T7 assay as (B), but applied to emilin1b target amplicons. (D) Brightfield macroscopic image of a representative series of uninjected 3 dpf larvae. Scale bar: 1 mm. (E) Similar image of emilin1a/b fish. Note that fish are generally normal in appearance. (F) Confocal micrograph of uninjected 3 dpf Tg(kdr:gfp) trunk vasculature. DA: dorsal aorta, ISV: intersegmental vessel, scale bar: 100 µm. (G) Similar micrograph taken of an emilin1a/b knockout fish. DA is traced in blue to emphasize tortuosity. Note the generally lower diameter of vessels, (H) Uninjected 3 dpf Tg(fli1a:nls-gfp); Tg(kdrl:ras-mcherry) trunk vasculature. DA: dorsal aorta, ISV: intersegmental vessel. Endothelial cell nuclei are labelled with GFP, making quantification possible. (I) Similar micrograph taken from an emilin1a/b knockout fish. These parameters are qualified in the following five panels: (J) DA diameter, (K) ISV diameter, (L) DA endothelial cell count, (M) ISV endothelial cell count, (N) DA tortuosity. With the exception of (N) all parameters are significant as indicated (t-test).