
|
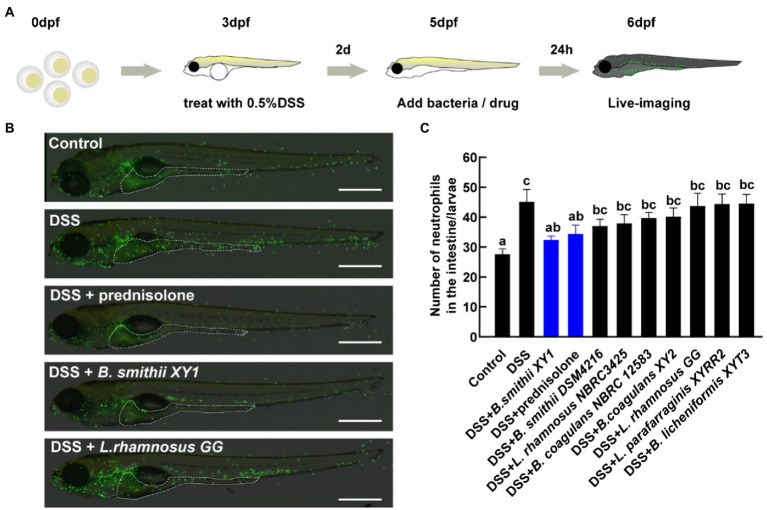
Figure 4
Second hits on reducing intestinal inflammation. (A) Schematic depicts the screening methodology to suppress neutrophilic inflammation. (B) Representative images of live imaging in 6 days post-fertilization (dpf) Tg (mpx:EGFP)i114 larvae exposed to 0.5% DSS at 3 dpf and treated with a drug and bacteria at 5 dpf. The area of the intestine is illustrated by a white dotted line, scale bars, 500 μm. (C) The number of neutrophils in the intestine per larvae, data are presented as mean ± SEM. Values indicated by the bars with different letters are significantly different (p < 0.05, one-way ANOVA). n ≥ 8 biologically independent animals from three independent experiments.