
|
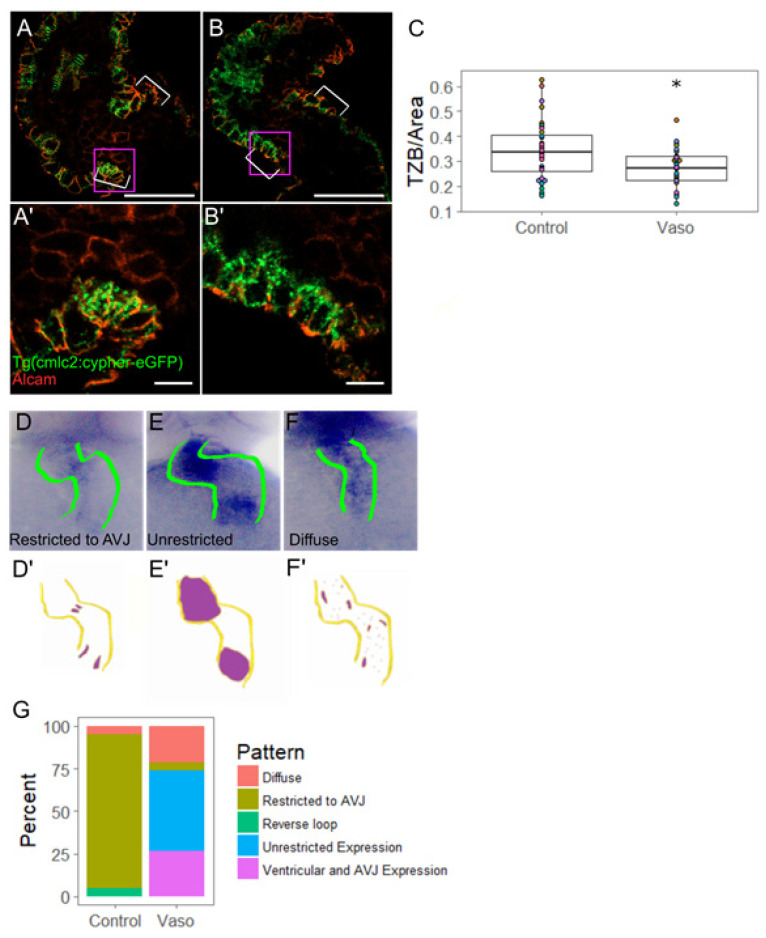
Figure 5 Increased pressure alters AVJ myocyte morphology and specification. (A) Control and (B) vaso-treated hearts showing z-disks and cell shape through ALCAM immunohistochemistry at 56 hpf. Purple box shows region of interest shown in (A′,B′). For (A,B), scale bar represents 20 µm. (A′) Control and (B′) vaso-treated hearts. Scale bar represents 10 µm. White arrow heads indicate AVJ. (C) TZB of sarcomeres present in each cell normalized to the area of each cell (1/µm). n = 36 cells for control and 33 for vaso-treated hearts. (D) In situ hybridization (ISH) of myocardial AVJ marker bmp4 in control and (E,F) vaso-treated hearts. (D′–F′) Diagrams of ISH expression patterns. (G) Percent of fish expressing a particular bmp4 expression pattern. A total of 20 fish were scored in each group. * indicates p < 0.05.