
|
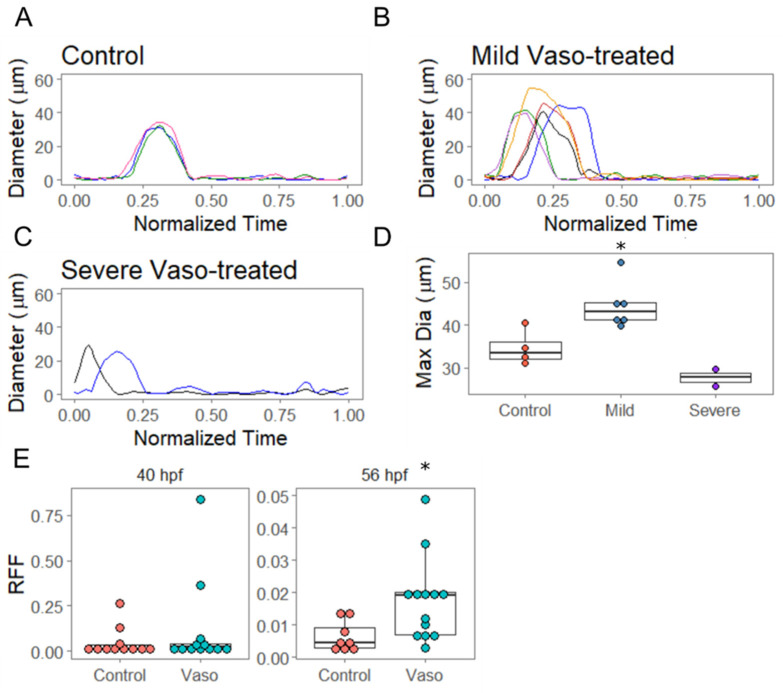
Figure 4 Increased afterload increases retrograde flow and alters AVJ mechanics. (A) Diameter of the flow field at the atrioventricular junction in control hearts at 56 hpf. X–axis is normalized time across a cardiac cycle, where 0 corresponds to the beginning of atrial contraction and 1 represents the end of ventricular contraction. n = 4 (B) Diameter analysis of vaso-treated hearts that showed hypertrophic growth between 40 and 56 hpf. n = 6 (C) Diameter analysis of vaso-treated hearts at 56 hpf. These hearts showed severely altered pumping mechanics at 40 hpf. (D) Maximum diameter analysis of control, vaso-treated hearts that showed altered pumping (AP) and vaso-treated hearts that showed hypertrophic growth (HH). (E) Retrograde flow fraction (RFF) at 40 and 56 hpf in control and vaso-treated hearts. n = 11 control and 12 vaso-treated fish. * indicates p < 0.05.