
Fig. 3
- ID
- ZDB-IMAGE-220113-19
- Publication
- Keller et al., 2021 - In vivo glucose imaging in multiple model organisms with an engineered single-wavelength sensor
- All Figures
- Figures for Keller et al., 2021
|
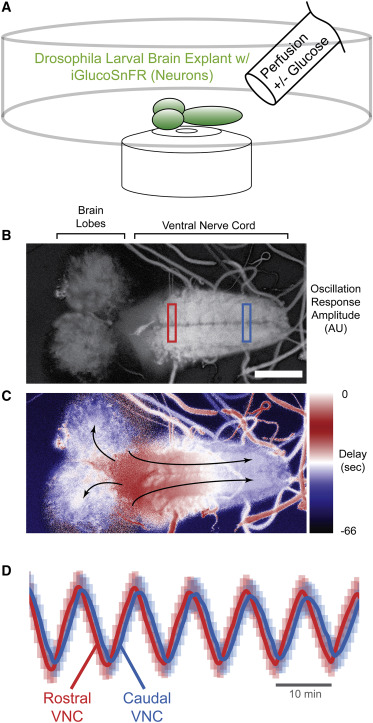
Fig. 3 (A) Schematic of assay. Third-instar larval fly CNS expressing iGlucoSnFR-mRuby2 in all neurons (57C10 driver), embedded in a thin layer of 1% agar, were subjected to continuous perfusion with and without glucose under continuous volumetric confocal imaging. Eight planes at 4.8-μm steps; two channels: Ex 488 nm, Em 505–550; Ex 561, Em 565–650; objective Plan-Apochromat 20×/0.8 NA M27, imaging rate ∼9 s per volume; 1,024 × 512 pixels; stimulus period 10 min. Scale bar, 100 μm. (B) FFT amplitudes of response. Time-lapse intensity-normalized average projections in z were subjected to pixelwise temporal FFT. Magnitudes at stimulus frequency were extracted and are represented in grayscale. (C) FFT phases/delays of response. Similar to (B), but here stimulus frequency phases were extracted, revealing a temporal gradient in glucose response along the axis of the VNC neuropil and to a lesser extent in the brain lobes (arrows indicate direction of response). (D) ΔF/Favg traces from VNC. Normalized fluorescence traces from rectangular regions of interest at rostral or caudal ends of VNC as indicated. Note phase shift. Error bars represent SD of pixels within each ROI.