
|
Fig. 2
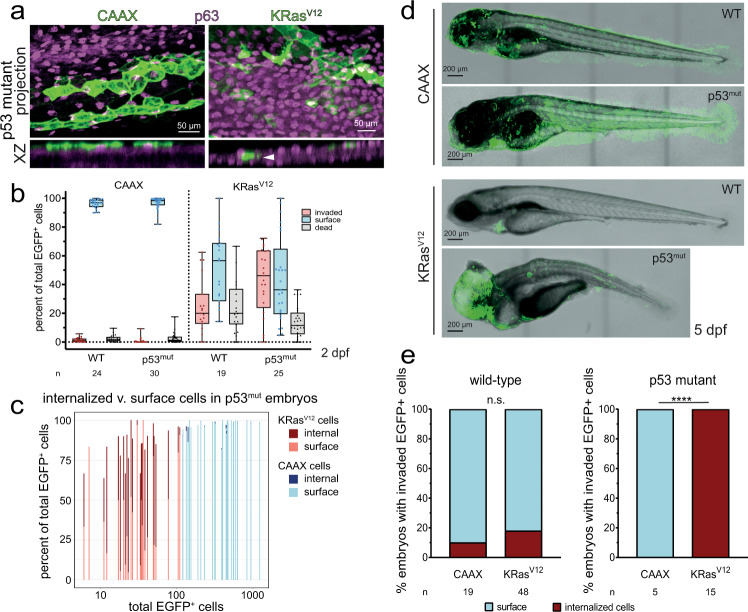
a Maximum intensity and XZ projections of EGFP-CAAX- or dt-KRasV12-injected p53mut 48 hpf embryos. The white arrowhead indicates a KRasV12 cell internalized beneath p63+ basal keratinocytes. b Quantification of invaded vs surface (live + dead) EGFP-CAAX or dt-KRasV12 cells in wild-type or p53mut embryos, expressed as a percentage of total EGFP+ cells for each embryo, n = embryos, ***P < 0.001 by a Chi-Square test. Data are represented as boxplots where the middle line is the median, the lower and upper hinges correspond to the first and third quartiles, and the whiskers extend from the minimum to the maximum. All data points are shown. c Percentage of internalized or surface cells in CAAX or dt-KRasV12 48 hpf embryos compared to total EGFP+ cells in each embryo (X-axis, log scale), where each line represents an individual p53mut embryo from (b). d Wild-type or p53mut larvae at 5 dpf expressing EGFP-CAAX or dt-KRasV12. Note that the cmlc2:GFP heart cells represent a Tol2 transgenesis marker, unrelated to CAAX or KRasV12 expression. e Percentages of 5 dpf larvae containing surface or invaded EGFP+ cells, ****P < 0.001 by a Fisher exact test. Source data are provided as a Source Data file.