
IMAGE
Figure 1—figure supplement 2—source data 1.
- ID
- ZDB-IMAGE-211224-19
- Source
- Figures for Choi et al., 2021
Image
|
Figure Caption
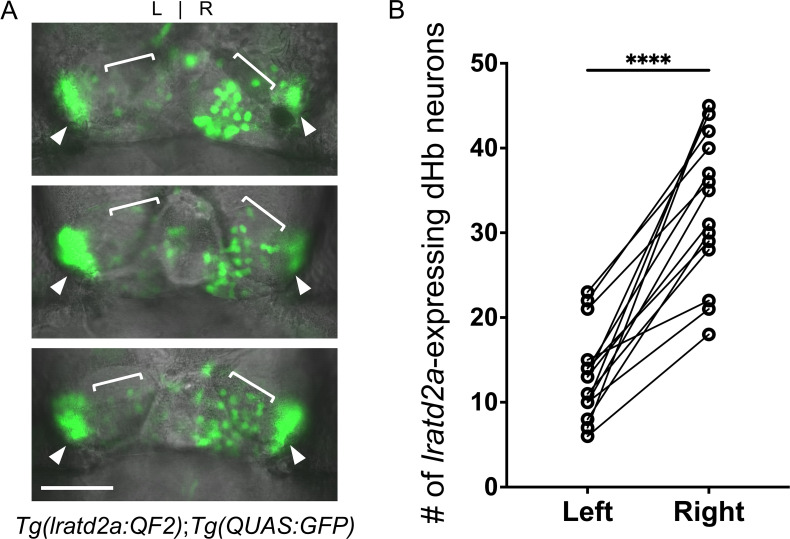
Figure 1—figure supplement 2—source data 1. Asymmetry of lratd2a-expressing dHb neurons.(A) Dorsal views of the habenular region of three Tg(lratd2a:QF2); Tg(QUAS:GFP) larvae at 7 dpf. Each confocal image is a single focal plane (1 μm). Brackets indicate regions of lratd2a-expressing neurons in the dHb and arrowheads point to the bilateral vHb. Scale bar, 25 μm. (B) Quantification of lratd2a-expressing dHb neurons. Each line connecting the circles corresponds to a single larva. Mean is 13.1 ± 1.4 cells in the left dHb and 33.5 ± 2.3 cells in the right, n = 15 larvae [p < 0.0001, paired t-test].
Acknowledgments
This image is the copyrighted work of the attributed author or publisher, and
ZFIN has permission only to display this image to its users.
Additional permissions should be obtained from the applicable author or publisher of the image.
Full text @ Elife