
Image
|
Figure Caption
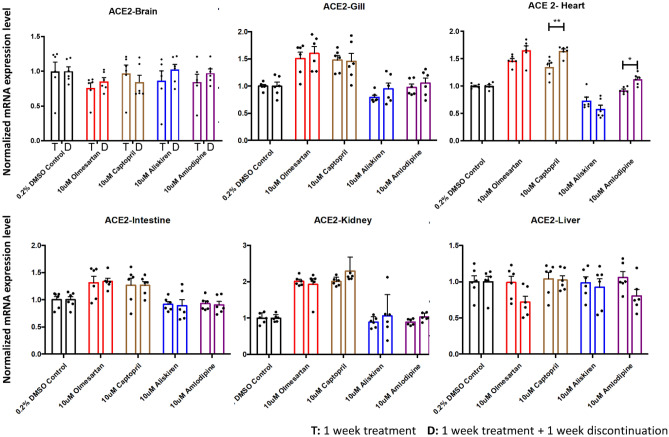
Figure 5 Comparison of ace2 expression levels between treatment and discontinuation. The expression levels were compaired between the 1-week treatment group and 1-week treatment plus 1-week discontinuation group for different organs. The captopril and amlodipine treatment increased ace2 mRNA expression in the heart 7 days after discontinuation compared to 7-day treatment (n = 6 per group; *p < 0.05, **p < 0.01, unpaired t test). Other organs showed no significant difference between treatment and discontinuation. T: 1 week treatment D: 1 week treatment + 1 week discontinuation.
Acknowledgments
This image is the copyrighted work of the attributed author or publisher, and
ZFIN has permission only to display this image to its users.
Additional permissions should be obtained from the applicable author or publisher of the image.
Full text @ Sci. Rep.