
|
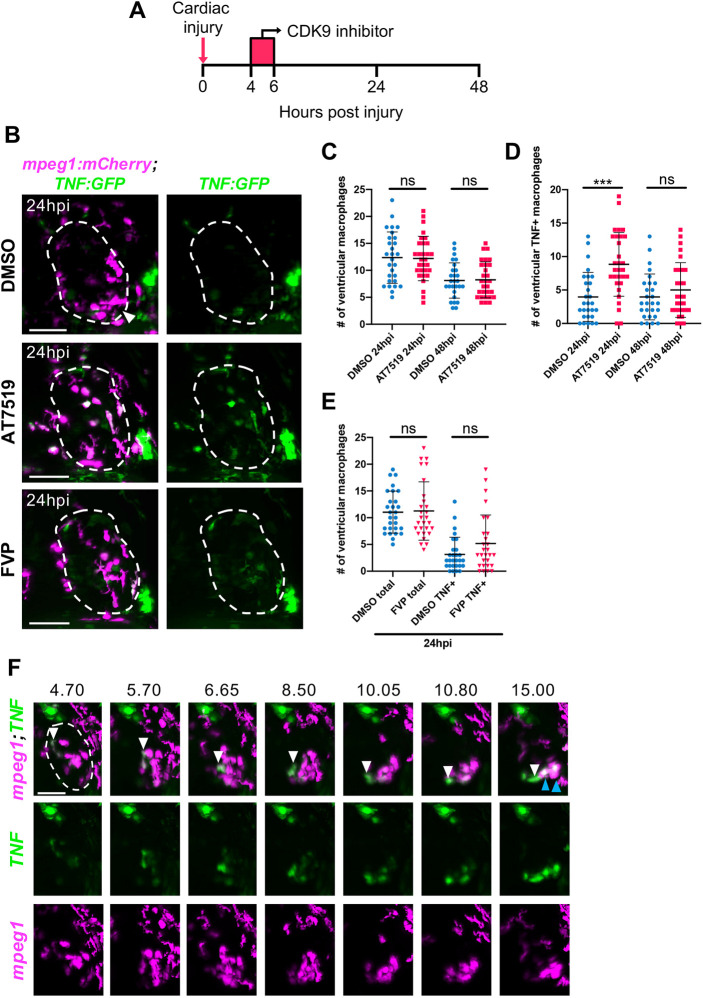
Fig. 3.
Transient CDK9i treatment does not affect cardiac macrophage numbers and AT7519 enhances wound macrophage tnf polarisation following injury. (A) Experimental timeline indicating cardiac injury, transient CDK9i treatment and imaging time points. (B) LSFM images of Tg(mpeg1:mCherry;TNFa:GFP) larvae displaying macrophage accumulation and tnf expression on the injured ventricle at 24 hpi following transient treatment with 0.3% DMSO vehicle (top), 50 μM AT7519 (middle) or 3 μM FVP (bottom). Arrowhead indicates ventricular apex injury site. (C,D) Number of ventricular macrophages (C) and ventricular tnf+ macrophages (D) at 24 hpi and 48 hpi following transient AT7519 (50 μM) treatment. (E) Number of ventricular macrophages (total and tnf+) at 24 hpi following transient FVP (3 μM) treatment. (C-E) Error bars represent s.d., n=28 larvae, experimental n=3. ***P<0.001 (one-way ANOVA and Tukey post-hoc test for comparisons between treatment groups). ns, non-significant. (F) LSFM time-lapse-derived images displaying macrophage migration and tnf expression on the injured ventricle, hpi indicated above each image. White arrowhead (top, all time points) tracks an individual tnf+ macrophage (mpeg1low) migrating to the ventricular apex. Blue arrowheads (top, 15.00 hpi) indicate two macrophages that have upregulated their tnf expression at the injured ventricular apex. LSFM fluorescence images were acquired in 3D and maximum intensity projections are displayed. Dashed line indicates outline of ventricle. Scale bars: 50 μm.