
Image
|
Figure Caption
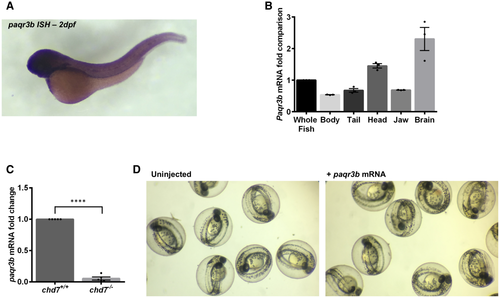
Fig. EV5 A, B. Expression profile of paqr3b in whole-mount zebrafish by in situ hybridization (A) and in tissues by qRT–PCR (B). N = 4. C. qRT–PCR validation of the downregulation of paqr3b (N = 4; ****P < 0.0001, Student’s t-test). D. Images of gross morphology of 2 dpf zebrafish embryos with or without overexpression of paqr3b mRNA. Of note, neither abnormalities nor death were observed in zebrafish embryos upon overexpression of paqr3b mRNA. Data information: Data are presented as mean ± SEM. n is the number of fish used. N is the number of experimental repeats.
Acknowledgments
This image is the copyrighted work of the attributed author or publisher, and
ZFIN has permission only to display this image to its users.
Additional permissions should be obtained from the applicable author or publisher of the image.
Full text @ EMBO Rep.