
|
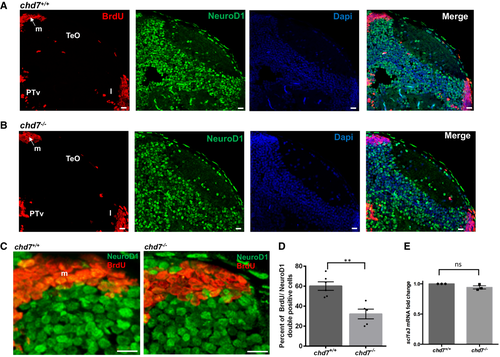
Fig. EV4 A, B. Immunostaining with BrdU and NeuroD1 in brain sections of the zebrafish tectal region in chd7+/+ (A) and chd7−/− (B). The scale bar is 10 μm. Tel: Telencephalon; TeO: tectum opticum, m: medial tectal, DT: dorsal thalamus, PTd: dorsal part of posterior tuberculum, PTv: ventral part of posterior tuberculum, l: lateral tectal proliferation zone. C. Immunostaining with BrdU and NeuroD1 in brain sections of the zebrafish medial tectal region. Scale bar = 10 μm. m: medial tectal. D. The percentage of BrdU and NeuroD1-double positive cells among BrdU-positive cells in the medial tectal zone (N = 3, chd7+/+: n = 6; chd7−/−: n = 6; **P < 0.05; Student’s t-test). E. Expression level of scl1a3 mRNA in chd7−/− relative to chd7+/+ (N = 4). ns, not significant; Student’s t-test. Data information: Data are presented as mean ± SEM. n is the number of fish used. N is the number of experimental repeats.