
|
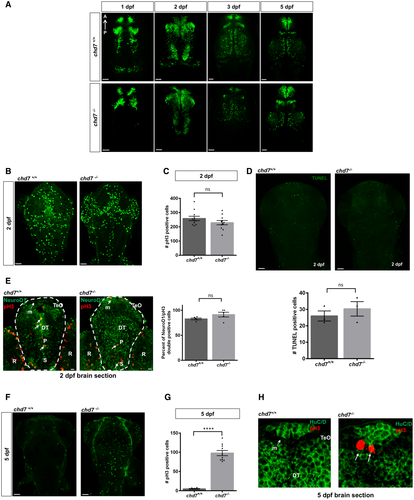
Fig. EV2 Analysis of GABAergic neurons network development between 1 dpf and 5 dpf between control (top row) and chd7 mutants (bottom row) (N = 3). Proliferation analysis by pH3 staining at 2 dpf in control and chd7 mutants. Bar graph showing no difference in pH3-positive cells in zebrafish brain at 2 dpf between control and mutants (n = 11; ns, P = 0.1816; Student’s t-test). Cell death analysis by TUNEL assay in chd7−/− and chd7+/+ brains shows no change in apoptotic cells at 2 dpf (N = 3, n = 8; ns, P = 0.464; Student’s t-test). Transverse sections of 2 dpf larvae after immunostaining with pH3 (red) and NeuroD1 (green). Bar graph showing no difference in pH3 and NeuroD1 double-positive cells (arrows) in zebrafish brain at 2 dpf between control and mutants (N = 3, n = 5; ns, P = 0.124; Student’s t-test). P: pallium, S: subpallium, TeO: tectum opticum, m: medial tectal proliferating zone, DT: dorsal thalamus R: retina. Proliferation analysis by pH3 staining at 5 dpf in control and chd7 mutants. An increase in pH3-positive cells was noted in brains of mutant fish compared with controls at 5 dpf (N = 4, n = 10; ****P < 0.0001; Student’s t-test). Transverse sections of 5 dpf larvae after immunostaining with pH3 (red) and HuC/D (green). pH3-positive cells (arrows) were observed at 5 dpf in the medial tectal proliferating zone of mutant fish brains but none in controls (N = 3). P: pallium, S: subpallium, TeO: tectum opticum, m: medial tectal proliferating zone, DT: dorsal thalamus. Data information: Data are presented as mean ± SEM. Scale bar = 50 μm and 10 μm for 2 dpf NeuroD1 and pH3 co-stain.