
|
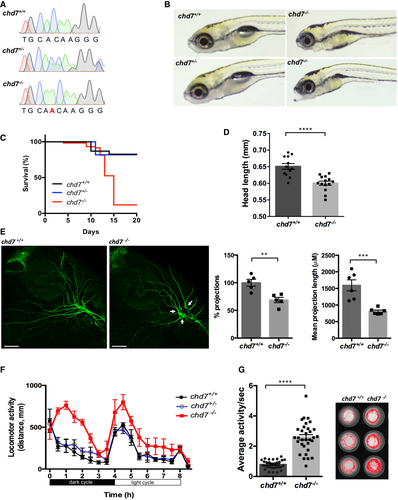
Fig. 1 Chromatograms showing the confirmation a 1-nucleotide insertion mutation by Sanger sequencing. Gross morphological analyses of control (chd7+/+; top left image), heterozygous (chd7+/−; bottom left image) and knockout mutants (chd7−/−; images in right panel). Kaplan–Meier survival plot showing low survival of chd7 mutants after 12 dpf (N = 5). Measurement of head size of control (n = 12) and mutants (n = 14) showing significantly smaller head size in chd7−/− fish (****P < 0.0001, Student’s t-test). Acetylated tubulin staining in 28 hpf controls (left) and mutants (right) showing severely affected outbranching of the trigeminal nerve (Vth cranial nerve). Notably, chd7−/− display reduced branching of the Vth cranial nerve (arrows) and axonal arborization in the tectal area. Graphs showing quantitative analyses of percentage (n = 5) and mean total length of peripheral projections (n = 6) per zebrafish in controls and mutants (***P < 0.001; **P < 0.005, Student’s t-test). Locomotor activity of control (black), heterozygous (blue) and mutants (red) showing significant hyperactivity of mutants in dark and light cycles (N = 3, n = 48). Average activity per second during dark cycle (left) is significantly increased in chd7−/− mutants compared with chd7+/+ (n = 32; ****P < 0.0001, Student’s t-test). Representative swimming tracks during dark cycle of control and mutant fish (right). Mutant chd7−/− larvae displayed hyperactive swimming. Data information: ****P < 0.0001; ***P < 0.001; **P < 0.005, Student’s t-test. Data are presented as mean ± SEM. Scale bar = 50 μm. n represents number of fish. N represents number of experimental repeats.