
|
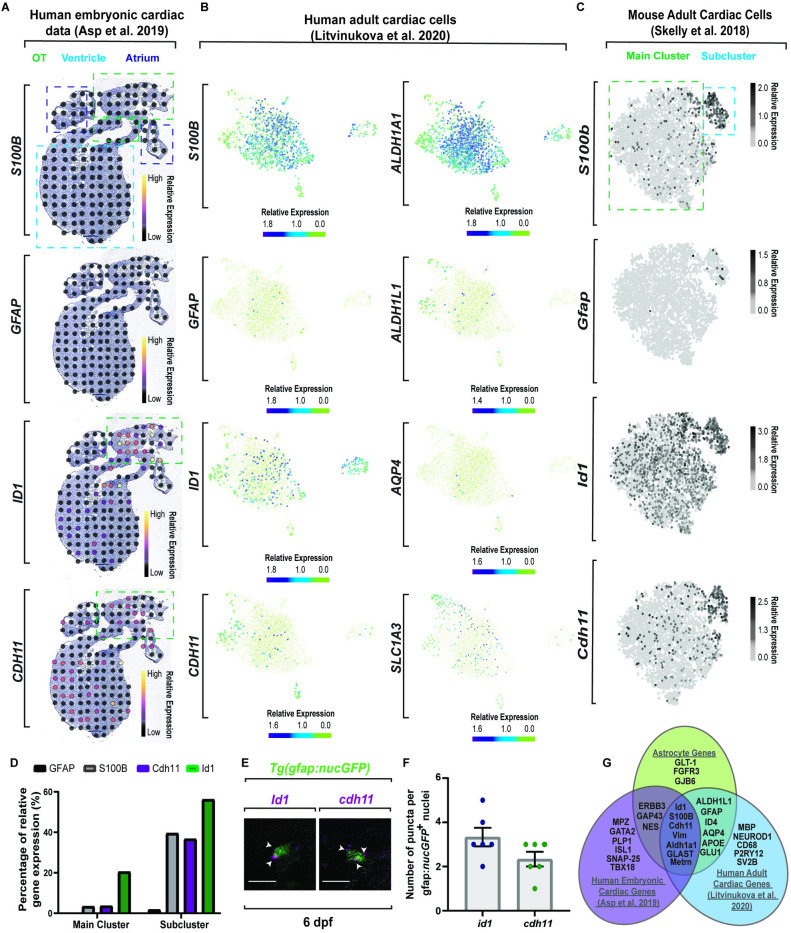
Fig 5 Molecular dissection of astroglia genes in the heart across species. (A) Spatiotemporal sequencing [64] of human embryonic hearts. Developmental astrocyte-associated genes are expressed. Dot color denotes relative transcript expression based on raw reads per spot. (B) Single-cell sequencing [65] from the neuronal cluster of human adult hearts. Scale bar denotes relative gene expression. (C) Single-cell sequencing [66] of astrocyte genes in the fibroblast cluster from adult mouse tissue. Scale bar denotes relative gene expression. (D) Quantification of published adult mouse single-cell sequencing [66] from the fibroblast cluster indicates a conserved subcluster with astrocyte gene up-regulation. (E) Confocal z-section of 6 dpf Tg(gfap:nucGFP) zebrafish embryos with id1 or cdh11 RNAScope. id1/cdh11+ puncta (white arrowheads) localize to nucGFP+ cells. (F) Quantification of id1 and cdh11 RNAScope puncta per cell. (G) Venn diagram of published sequencing data from human embryonic hearts [64], human adult heart [65], and classic astrocyte genes. Data are represented as mean ± SEM. Scale bar equals 10 μm. Statistics summarized in S1 Table. See S1 Data for raw data. dpf, days postfertilization; OT, outflow tract.