
Fig 3
|
Fig 3
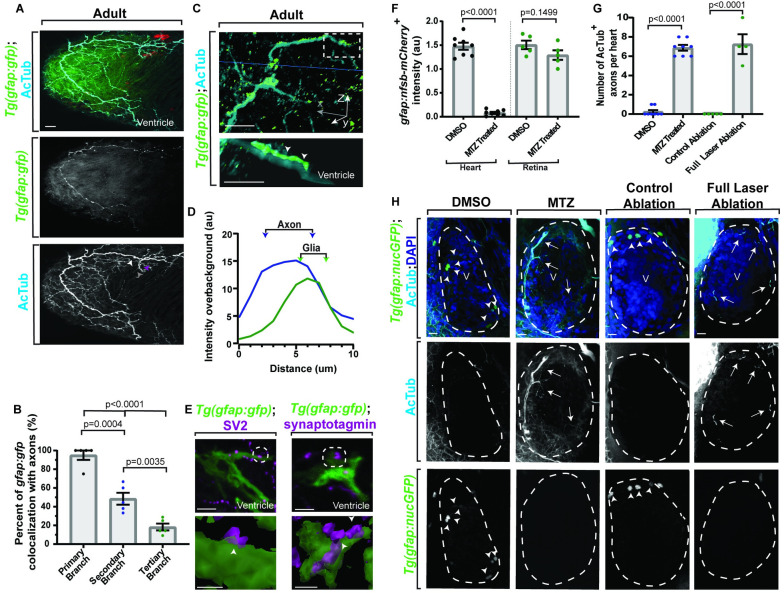
(A) Confocal 10 μm z-projection from adult Tg(gfap:gfp) heart stained with AcTub. Axons have primary (white arrowhead), secondary (purple arrowhead), and tertiary (gray arrowhead) branches. (B) Quantification of colocalization between primary, secondary, and tertiary branches of axons and gfap+ cells. (C) Top: confocal 10 μm z-projection of adult Tg(gfap:gfp) heart stained with AcTub and rotated 90°. Bottom: 3D rendering of the AcTub and GFAP (white dotted box) are presented below. The gfap+ cells associate with axons (white arrowheads). (D) Representative quantification of intensity over distance of AcTub and GFAP. (E) Top: confocal maximum z-projection of adult Tg(gfap:gfp) ventricles stained with SV2 or Synaptotagmin. Bottom: 90°-rotated 3D rendering of contact points (white arrowheads) between GFAP and SV2 or Synaptotagmin. (F) Quantification of Tg(gfap:nsfb-mCherry+) intensity in the heart or retina (location control) after injection of DMSO or MTZ. (G) Quantification of axonal number after MTZ or full laser ablation of nucGFP+ cells. (H) Confocal maximum z-projection of ventricle (white dotted outline) of 6 dpf Tg(gfap:nucGFP) with either MTZ injection or full laser ablation of nucGFP+ cells and stained with AcTub. Arrows indicate increased innervation and arrowheads indicate nucGFP+ cells. Data are represented as mean ± SEM. Scale bar equals 10 μm. Statistics summarized in S1 Table. See S1 Data for raw data. AcTub, acetylated tubulin; dpf, days postfertilization; MTZ, metronidazole; V, ventricle.