
|
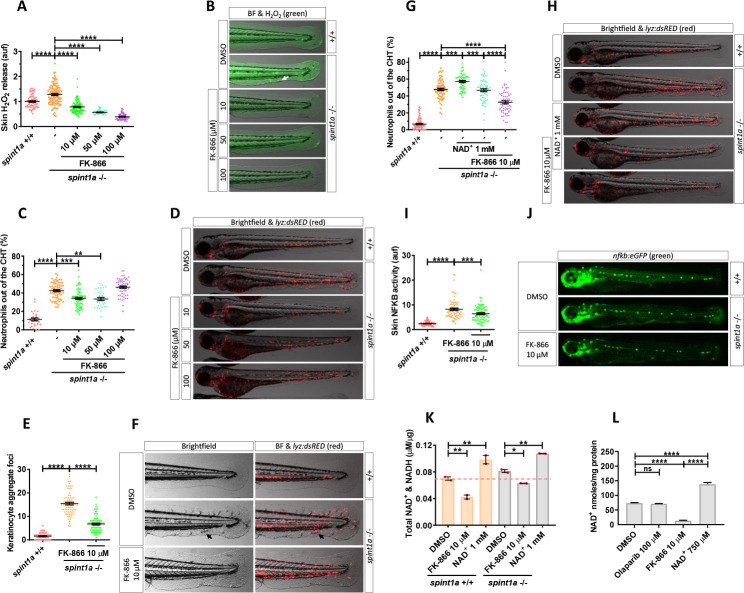
Fig 2
(A) Quantification of skin H2O2 production in wild-type and Spint1a-deficient zebrafish larvae treated with FK-866 (0, 10, 50, and 100 μM). (B) Representative merge images (brightfield and green channel) of zebrafish larvae of every group are shown. The white arrow indicates a keratinocyte aggregate where H2O2 release was high. (C) Neutrophil distribution of wild-type and Spint1a-deficient zebrafish larvae treated with increasing doses of FK-866. (D) Representative merge images (brightfield and red channel) of lyz:dsRED zebrafish larvae of every group are shown. (E) Number of keratinocyte aggregates in the tail skin of larvae treated with 10 μM FK-866. (F) Detailed representative merge images (brightfield and red channel) of the tail of wild-type and Spint1a-deficient larvae treated with vehicle (DMSO) or 10 μM FK-866. Black arrows indicate keratinocyte aggregates and immune cell recruitment presents in nontreated Spint1a-deficient skin. (G) Neutrophil distribution of zebrafish embryos treated with 1 mM NAD+ in the presence or absence of 10 μM FK-866. (H) Representative merge images (brightfield and red channels) of lyz:dsRED zebrafish larvae of every group are shown. (I) Quantification of fluorescence intensity of wild-type and Spint1a-deficient embryos treated with 10 μM FK-866. (J) Representative images (green channel) of NF-kB:eGFP zebrafish larvae of every group are shown. (K) Wild-type and Spint1a-deficient larvae of 72 hpf treated for 48 hours with 10 μM FK-866 and 1 mM NAD+ were used for total NAD+ and NADH determination by ELISA. (L) Spint1a-deficient larvae of 72 hpf treated for 48 hours with 100 μM olaparib, 10 μM FK-866 and 750 μM NAD+ were used for NAD+ determination by enzymatic cycling method. Each dot represents one individual, and the mean ± SEM for each group is also shown. p-Values were calculated using 1-way ANOVA and Tukey multiple range test. ns, not significant, **p ≤ 0.01, ***p ≤ 0.001, ****p ≤ 0.0001. The data underlying this figure can be found in S1 Data. ANOVA, analysis of variance; NAD+, nicotinamide adenine dinucleotide; Nampt, nicotinamide phosphoribosyltransferase.