
|
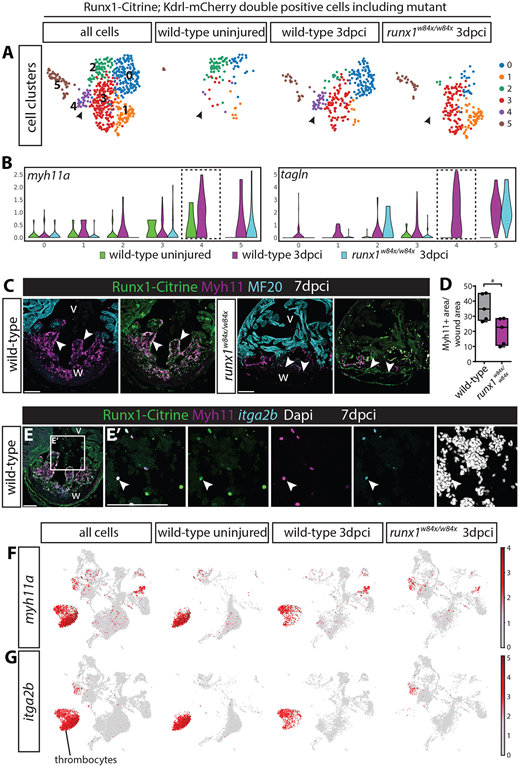
Fig. 7 (A) UMAP plot of Tg(BAC-runx1P2:Citrine;kdrl:Hsa.HRASmCherry) double-positive cells in the 3 dpci runx1 mutant as well as uninjured and 3 dpci wild-type cells. Arrowheads indicate the double-positive cluster 4 that is absent in the runx1 mutant. (B) Violin plot showing that the absent cluster 4 is the cluster most strongly expressing smooth muscle genes in the wild type after injury. (C) Immunohistochemistry for Citrine, Myh11 and MF20, showing reduced staining for Myh11 in the runx1 mutant wound at 7 dpci compared with the wild type. Arrowheads indicate overlap of Myh11 with Citrine in the endocardium. (D) Quantification of the area of Myh11 expression in the wound on sections between mutants and wild types. n=5, unpaired two-tailed t-test. *P<0.05. Box extends from the 25th to 75th percentiles and whiskers indicate minimum to maximum with all data points shown. (E,E′) In situ hybridisation for itga2b combined with immunohistochemistry for Citrine and Myh11 with nuclear marker Dapi. Arrowheads indicate Myh11-expressing blood cells that express the thrombocyte marker itga2b. (F,G) UMAP plot of all cells confirms expression of myh11a in the itga2b-positive thrombocyte cluster. v, ventricle; w, wound. Scale bars: 100 μm.