
|
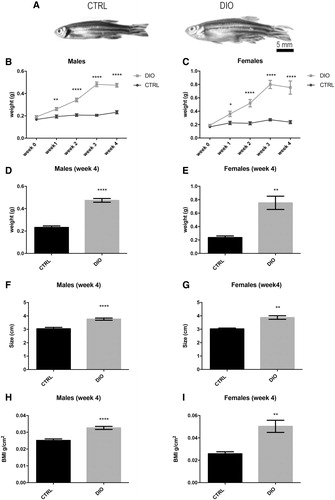
Fig. 1 DIO results in increased body weight, length, and BMI in both male and female zebrafish. (A) Zebrafish pictures highlighting the morphological differences at week 4 in male. (B, C) Graphs illustrating the body weight measurements during 4 weeks for both CTRL and DIO-treated zebrafish in male and female, respectively. (D, E) Body weight at week 4 in male and female, respectively. (F, G) Body length at week 4 in male and female zebrafish, respectively. (H, I) BMI (g/cm2) calculated at week 4. n = 8–10 for males and n = 3–4 for females. Error bars correspond to SEM. Two-way ANOVA (B, C) and Student's t-test (D–I) *p < 0.05; **p < 0.01; ****p < 0.0001. Scale bar: 7 mm. ANOVA, analysis of variance; BMI, body mass index; CTRL, control; DIO, diet-induced obesity/overweight; SEM, standard error of the mean.