
|
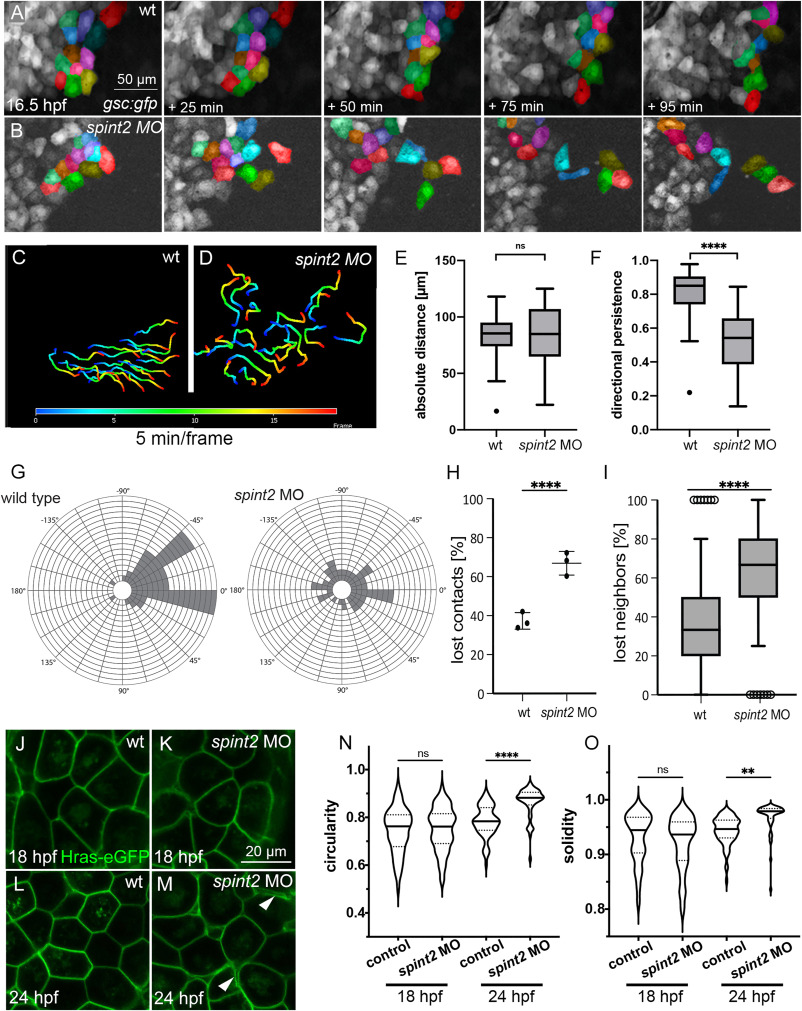
Fig. 6 A-B. Fluorescent stills of time-lapse recordings of embryos transgenic for Tg(-1.8gsc:gfp) starting at 16.5 hpf, showing less-organized migration routes of individual hatching gland cells in spint2 morphants (B) compared to wild type (A). A subset of cells is false-colored. C-D. Migration routes of 20 individual hatching gland cells tracked for 90 min starting at 16.5 hpf in a wild-type embryo (C) and spint2 morphant embryo (D), determined using the Axiovision software. The color code indicates the frame number from 0 (16.5 hpf; dark blue) to 20 (18 hpf; red). E,F. Quantification of the absolute migration distance (E) and directional persistence determined by the ratio of the linear displacement to the absolute migration distance (F) of hatching gland cells tracked in C and D; Tukey box and whiskers plot; N = 3 embryos, n = 20 cells; p = 0.7271 (ns) or <0.0001 (∗∗∗∗) (Student’s t-test). G. Rose blots displaying the angle of the migration directionality of individual cells tracked in C and D relative to the average angle of all cells. Each field indicates one cell. H. Quantification of the number of lost cell-cell contacts of neighboring cells tracked for 50 min in wild-type and spint2 morphant embryos starting at 16.5 hpf; N = 3, n = 72–255, p = 0.0023 (Student’s t-test); each dot represents the average percentage of lost contacts in one embryo, error bars represent the standard deviation. I. Tukey box and whiskers plot representing the percentage of neighbors of a cell that were lost during a tracking period of 50 min starting at 16.5 hpf in wild-type (also shown in Figure 5O) and spint2 morphant embryos; N = 3 each, n = 28–64; ∗∗∗∗ indicates p value < 0.0001 determined via Student’s t-test. J-M. Live confocal images of hatching gland cells of embryos transgenic for Tg(Ola.Actb:Hsa.hras-egfp) at 18 hpf (J,K) or 24 hpf (L,M). Hatching gland cells display a polygonal shape in wild-type and early spint2 morphants (J,K,L) but are rounded up in 24 hpf spint2 morphants (M) Arrowheads point to detachments between adjacent HGCs. N,O. Quantification of the cell shape of HGCs shown in J-M. Violin plots show that the circularity (perfect circular shape = 1; elongated shapes <1) as well as the solidity (perfect convex shape = 1; gonal shapes <1) indices are not different in wild-type and spint2 morphants at 18 hpf but increased (more circular and less polygonal) in spint2 morphants at 24 hpf; N = 5–12 embryos, n = 51–94 cells; ∗∗ indicates p value of 0.008, ∗∗∗∗ indicates p value < 0.0001 determined via one-way ANOVA and Tukey’s post hoc test.
Reprinted from Developmental Biology, 476, Hatzold, J., Wessendorf, H., Pogoda, H.M., Bloch, W., Hammerschmidt, M., The Kunitz-type serine protease inhibitor Spint2 is required for cellular cohesion, coordinated cell migration and cell survival during zebrafish hatching gland development, 148-170, Copyright (2021) with permission from Elsevier. Full text @ Dev. Biol.