
|
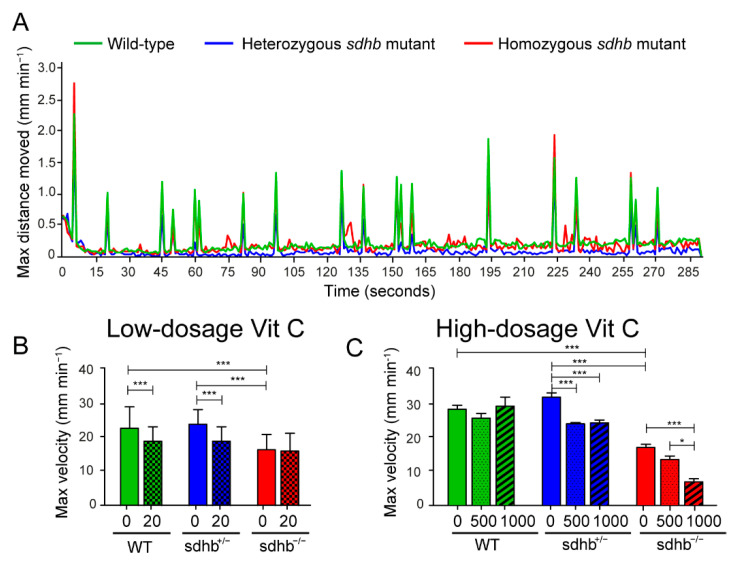
Figure 5
Startle response measurements at basal level and after low- and high-dosage levels of Vitamin C. (A) Optimized short protocol (<5 min in total) to quickly assess startle responses as a toxicity indicator induced by tapping stimuli with random intervals varying between 2 and 35 s. The max distance moved (mm min−1) is plotted against time per seconds. Between the wild-type (green line) and heterozygous mutants (blue line), no differences were observed, while homozygous sdhb mutants (red line) showed a decrease in moved distance. (B) Quantification of the average of the maximum velocity of three startle responses with or without the supplementation of low-dosage levels of Vitamin C (20 mg⋅L−1). Low-dosage levels of Vitamin C decreased the startle response of wild-type and heterozygous sdhb larvae while not affecting homozygous sdhb larvae. Larvae were supplemented with 20 mg⋅L−1 Vitamin C homozygous sdhb (n = 106), heterozygous sibling (n = 244), and wild-type sibling (n = 137) compared to the control group (indicated with 0 mg⋅L−1) consisting of homozygous sdhb larvae (n = 91), heterozygous sibling (n = 227), and wild-type sibling (n = 100) from five different replicates measured at 6 dpf. (C) Quantification of the average of the maximum velocity of three startle responses with or without supplementation of high-dosage levels of Vitamin C (500 and 1000 mg⋅L−1). Both 500 and 1000 mg⋅L−1 concentrations of Vitamin C induced a decreased startle response in heterozygous sdhb larvae, while only the 1000 mg⋅L−1 concentration of Vitamin C induced a decreased startle response in homozygous sdhb larvae and none of the high-dosage levels of Vitamin C significantly altered the startle response of the wild-type larvae. Larvae were supplemented with 500 mg⋅L−1 Vitamin C homozygous sdhb (n = 73), heterozygous sibling (n = 139), and wild-type sibling (n = 55), 1000 mg⋅L−1 Vitamin C homozygous sdhb (n = 20), heterozygous sibling (n = 37), and wild-type sibling (n = 19) compared to the control group (indicated with 0 mg⋅L−1) consisting of homozygous sdhb larvae (n = 32), heterozygous sibling (n = 48), and wild-type sibling (n = 40) from at least two different replicates measured at 6 dpf. One-way ANOVA with Tukey’s post hoc test, * p < 0.05 and *** p < 0.001.