IMAGE

Figure 4

ID
ZDB-IMAGE-211025-23
Source
Figures for Cairns et al., 2021
Image
Figure Caption

Figure 4

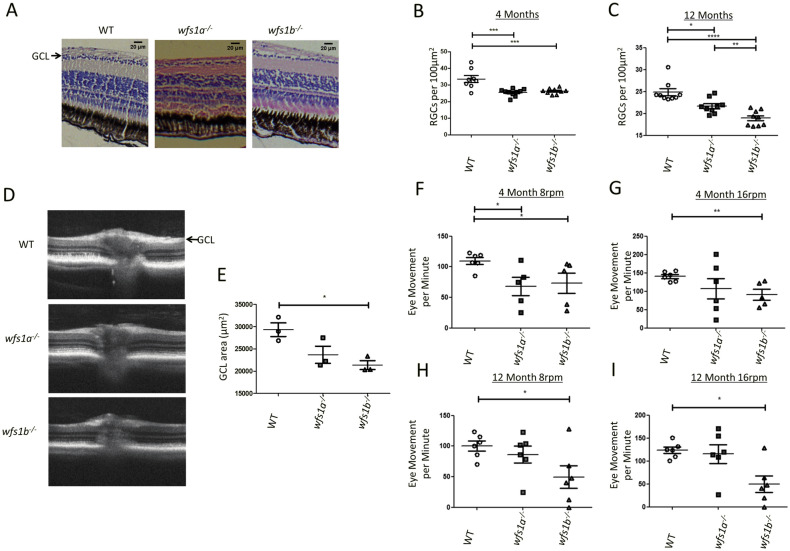
Retinal ganglion cell count and visual function in wfs1a−/− and wfs1b−/− zebrafish. (A) Representative images of WT, wfs1a−/− and wfs1b−/− retinal sections at 4 months of age (scale bar = 20 µm). For RGC counts, 6 boxes of the same area (100 μm2) were used with 3 boxes on either side of the optic nerve. The number of RGC cell bodies were counted and averaged. (B) RGC count per 100 μm2 at 4 months of age (WT n = 8; wfs1a−/− n = 10; wfs1b−/− n = 9). (C) RGC count per 100 μm2 at 12 months of age (WT n = 10; wfs1a−/− n = 9; wfs1b−/− n = 9). Data plots represent mean ± SEM. Statistical significance was calculated using the Kruskal–Wallis test (One-way ANOVA on ranks). (D) Optical coherence tomography (OCT) images of retinal cross-sections from 12-month-old zebrafish showing significant thinning of the ganglion cell layer (GCL) in wfs1a−/− and wfs1b−/− zebrafish (arrow). (E) Measurement of GCL area (WT mean = 29,393 ± 2653 μm2; wfs1a−/− mean = 23,688 ± 3332 μm2; wfs1b−/− mean = 21,363 ± 1,737 μm2; n = 3 for all 3 groups). Data plots represent mean ± SEM. Statistical significance was calculated using One-way ANOVA with Bonferroni’s multiple comparison tests. (F–I) Optokinetic response (OKR) of 4- and 12-month-old fish tested at 8 rpm and 16 rpm. Videos were recorded of fish eye tracking and the movements were manually counted (Supplementary video 3). Data plots represent mean ± SEM. Statistical significance was calculated using One-way ANOVA with Bonferroni’s multiple comparison tests. *p < 0.05; **p < 0.01; ***p < 0.005; ****p < 0.001; rpm: revolutions per minute.

Figure Data
Acknowledgments
This image is the copyrighted work of the attributed author or publisher, and ZFIN has permission only to display this image to its users. Additional permissions should be obtained from the applicable author or publisher of the image. Full text @ Sci. Rep.