IMAGE

Figure 3

ID
ZDB-IMAGE-211025-22
Antibodies
Source
Figures for Cairns et al., 2021
Image
Figure Caption

Figure 3

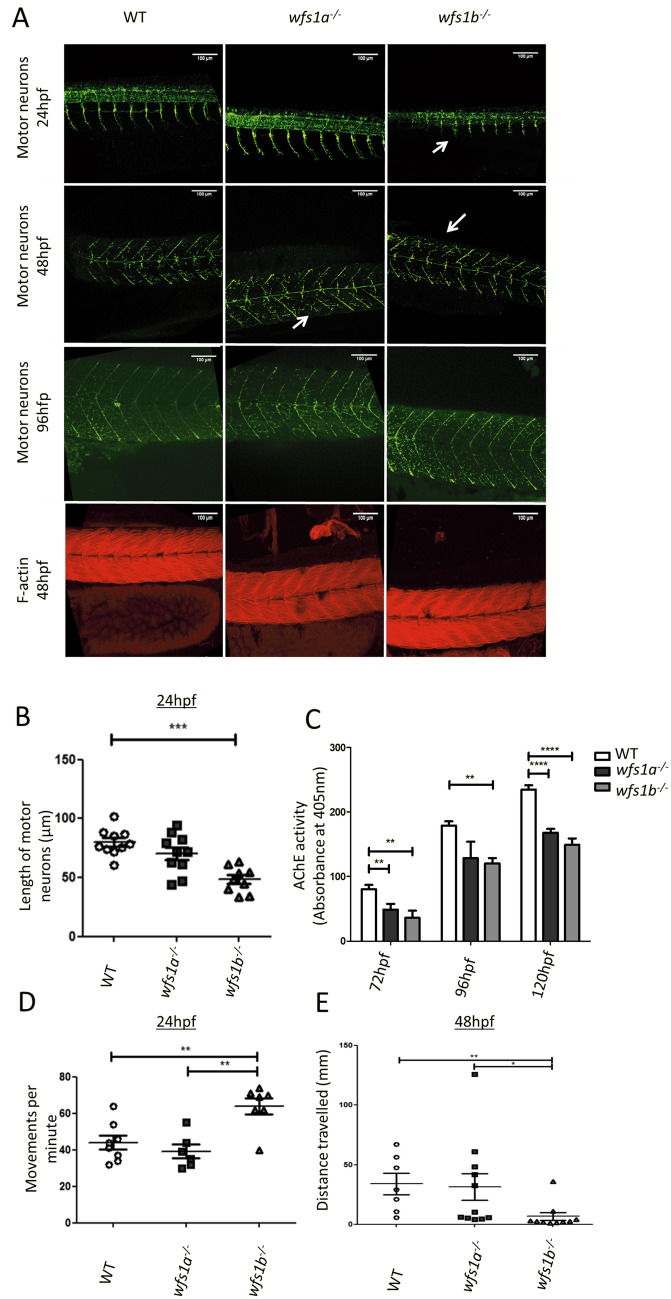
Neuronal development in wfs1a−/− and wfs1b−/− zebrafish. (A) Immunofluorescence of motor neurons (SV-2 stained using anti-SV2 antibody in green) and muscle fibres (F-actin stained using phalloidin in red). Shorter or missing neurons are highlighted with white arrows. (B) Quantification of the length of motor neurons in 24 hpf zebrafish (WT n = 10; wfs1a n = 11; wfs1b n = 9). For each fish, 9–10 neurons were measured and the average length was calculated. (C) Acetylcholine esterase (AChE) activity assay of developing zebrafish larvae (3–5 dpf). (D) Coiling response of zebrafish embryos at 24 hpf. The average movement per fish per minute was calculated from ~ 15 embryos (WT n = 8; wfs1a n = 6; wfs1b n = 7) (Supplementary Video 1). (E) Quantification of the touch response of zebrafish embryos at 48 hpf. The distance travelled was recorded in response to tactile stimulation (WT n = 8; wfs1a n = 11; wfs1b n = 10) (Supplementary Video 2). Data plots represent mean ± SEM. Statistical significance was calculated using One-way ANOVA with Bonferroni’s multiple comparison tests. **p < 0.01; ***p < 0.001; ****p < 0.0001; dpf days post-fertilisation.

Figure Data
Acknowledgments
This image is the copyrighted work of the attributed author or publisher, and ZFIN has permission only to display this image to its users. Additional permissions should be obtained from the applicable author or publisher of the image. Full text @ Sci. Rep.