IMAGE

Fig. 3

ID
ZDB-IMAGE-211010-4
Antibodies
Source
Figures for Zhao et al., 2021
Image
Figure Caption

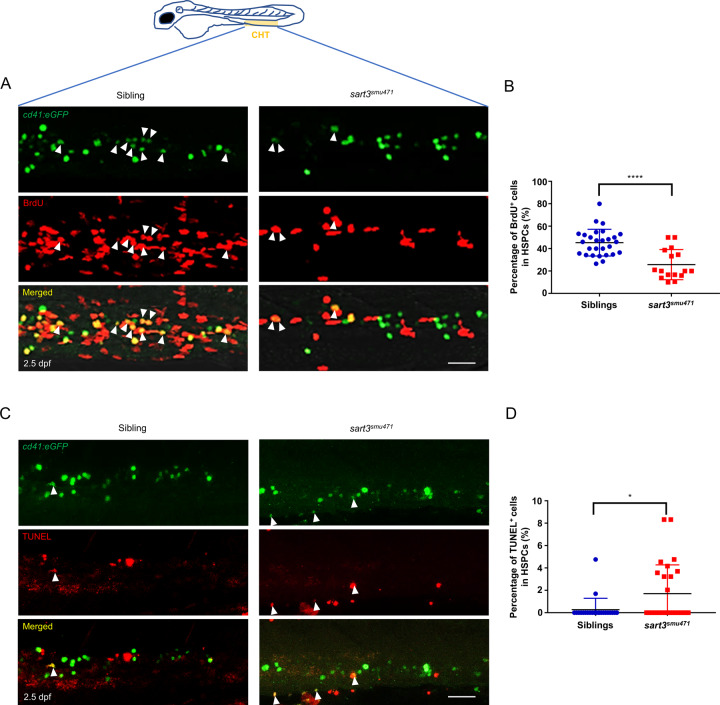
Fig. 3 Decreased HSPC proliferation and increased apoptosis in <italic>sart3</italic><sup><italic>smu471</italic></sup> mutants.

A, B Decreased HSPC proliferation in sart3smu471 mutants. A The BrdU incorporation assay. The white arrowheads indicate proliferating HSPCs (cd41:eGFPlow; BrdU double positive cells). Green indicates eGFP, red indicates BrdU. B Statistical analysis of the percentage of CHT localized cd41low HSPCs that incorporate BrdU (Student’s t-test, means ± SD; siblings, n = 28; sart3smu471 mutants, n = 16; ****P < 0.0001). C, D Increased HSPC death in sart3smu471 mutants. C The TUNEL assay. The white arrowheads indicate HSPCs undergoing cell death (cd41:eGFPlow; TUNEL double positive cells). Green indicates eGFP, red indicates TUNEL. D Statistical analysis of the percentage of CHT localized cd41low HSPCs labeled by TUNEL (Mann–Whitney U test, means ± SD; siblings, n = 24; sart3smu471 mutants, n = 27; *P < 0.05). Scale bars: 50 µm.

Figure Data
Acknowledgments
This image is the copyrighted work of the attributed author or publisher, and ZFIN has permission only to display this image to its users. Additional permissions should be obtained from the applicable author or publisher of the image. Full text @ Cell Death Dis.