IMAGE

Fig. 4

ID
ZDB-IMAGE-211009-18
Source
Figures for Jang et al., 2021
Image
Figure Caption

Fig. 4

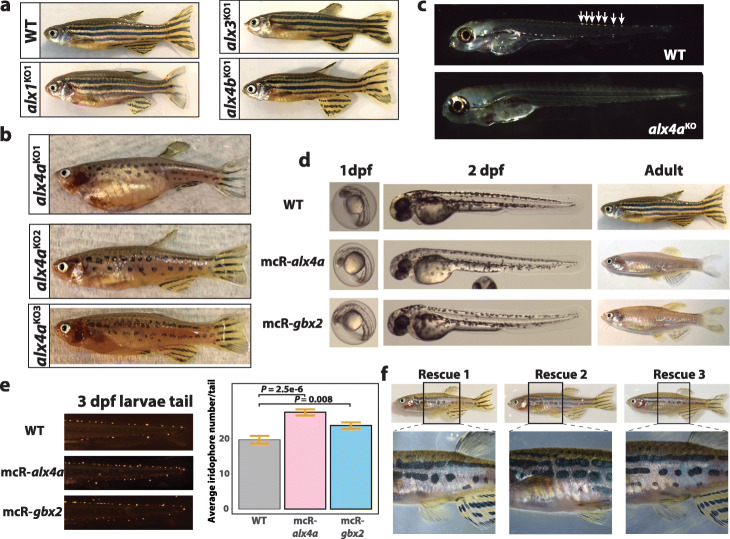
Functional validation of alx4a and gbx2 in iridophore development. a Lateral view of WT and alx1KO, alx3 KO, alx4b KO fish. b Lateral view of alx4a CRISPR-mediated knockout fish. c Iridophore detection in 4 dpf larvae of WT and alx4a knockout larvae. White arrows mark iridophores in WT larvae. d Lateral views of 1 dpf larvae, 2 dpf larvae, and adult fish comparing WT to Tg(miniCoopR-alx4a) and Tg(miniCoopR-gbx2) fish. e Representative pictures and quantification of iridophores from 3 dpf larvae tail trunks of WT (n = 21), Tg(miniCoopR-alx4a) (n = 20), and Tg(miniCoopR-gbx2) (n = 20). P values were calculated with two-tailed Welch’s t-test. Error bars represent ± SE. f Lateral whole-body view of iridophore rescue in three mosaic tg(miniCoopR-alx4a;alx4aKO) fish. Black box denotes the zoomed region in picture below

Figure Data
Acknowledgments
This image is the copyrighted work of the attributed author or publisher, and ZFIN has permission only to display this image to its users. Additional permissions should be obtained from the applicable author or publisher of the image. Full text @ Genome Biol.