
|
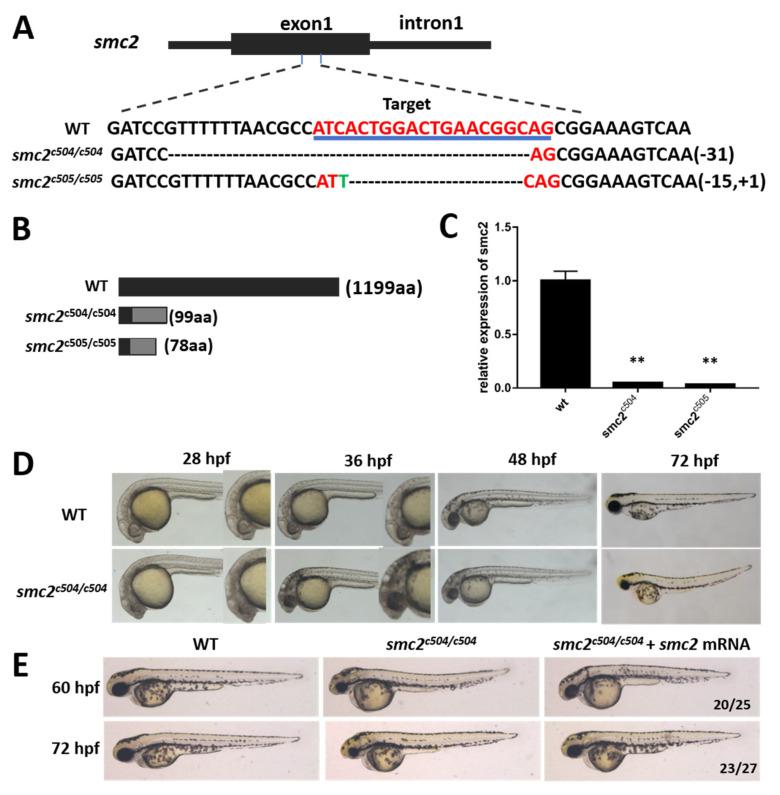
Figure 2
(A) Top panel: the schematic diagram shows the structure of the target region in the SMC2 gene. Black box, exon; solid line, introns. The bottom panel shows a comparison of the genomic DNA sequences among WT and two mutant alleles, SMC2c504/504 mutants carrying a 31-bp deletion and SMC2c505/505 mutants carrying a 15-bp deletion and 1-bp insertion. The target sequence is indicated in red and underlined. (B) Schematic structures of WT and truncated SMC2 proteins. (C) The relative mRNA levels of SMC2 in WT and homozygous mutants were assayed by qPCR at 4 dpf. The results are expressed as the mean ± SD of three independent experiments (**, p < 0.01; t-test). (D) Lateral views showing the morphology of WT and SMC2−/− mutants at 28, 36, 48 and 72 hpf. (E) Morphology of WT and SMC2−/− embryos injected with or without 200 pg SMC2-mRNAs at indicated stages. The smaller eyes and smaller head were significantly reduced in SMC2-mRNA-injected mutant embryos. The ratios at the bottom right corners indicate the number of embryos with indicated phenotypes vs. total number of observed embryos.