
Image
|
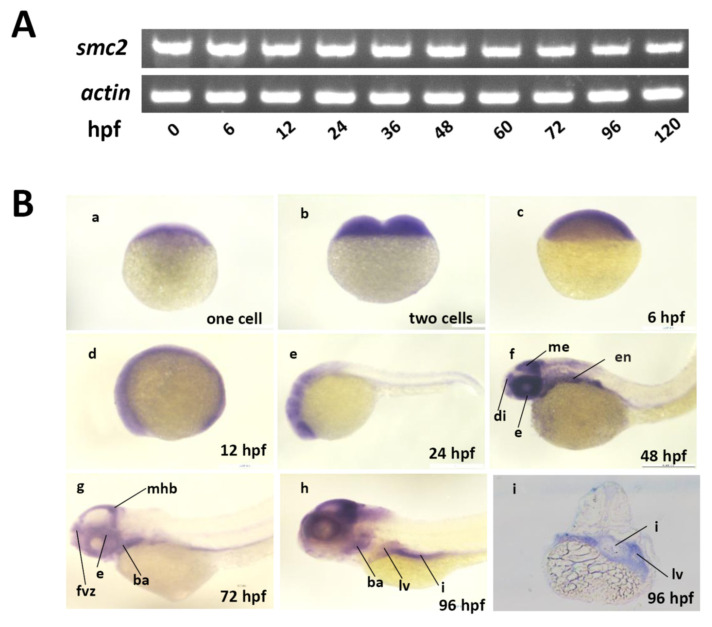
Figure Caption
Figure 1
Expression of SMC2 mRNA during zebrafish embryogenesis. (A) Expression levels of SMC2 at different stages were analyzed with RT-PCR and the expression of β-actin served as the control. (B) Detection of SMC2 transcripts during embryogenesis with WISH. hpf, hours post-fertilization; me, mesencephalon; di, diencephalon; fvz, forebrain ventricular zone; ba, branchial arches; mhb, midbrain–hindbrain boundary; i, intestine; en, endoderm; e, eye; lv, liver.
Figure Data
Acknowledgments
This image is the copyrighted work of the attributed author or publisher, and
ZFIN has permission only to display this image to its users.
Additional permissions should be obtained from the applicable author or publisher of the image.
Full text @ Biomedicines