
Image
|
Figure Caption
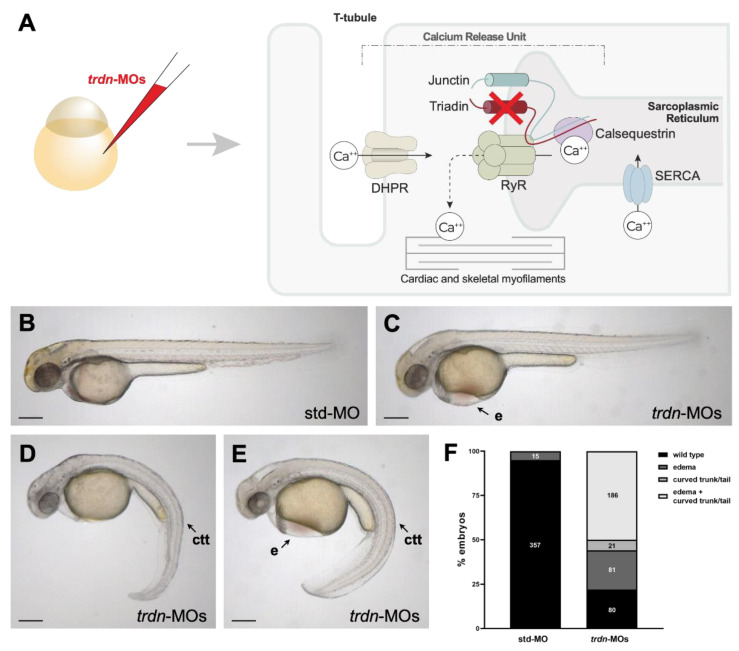
Figure 2
Phenotypical analysis of embryos with trdn loss-of-function. (A) Schematic representation of Triadin interactions network and trdn knockdown strategy. RyR: ryanodine receptor; DHPR: dihydropyridine receptor; SERCA: sarco-endoplasmic reticulum calcium ATPase (B–E) Representative bright field images of the phenotype of 48 hpf embryos injected with std-MO and trdn-MOs. (F) Classification of the phenotypes obtained with trdn-MOs injection. Values indicate the number of embryos for each phenotype. Scale bars indicate 100 μm. e, edema; ctt, curved trunk/tail.
Figure Data
Acknowledgments
This image is the copyrighted work of the attributed author or publisher, and
ZFIN has permission only to display this image to its users.
Additional permissions should be obtained from the applicable author or publisher of the image.
Full text @ Int. J. Mol. Sci.