IMAGE

FIGURE 2

ID
ZDB-IMAGE-210929-5
Source
Figures for Liu et al., 2021
Image
Figure Caption

FIGURE 2

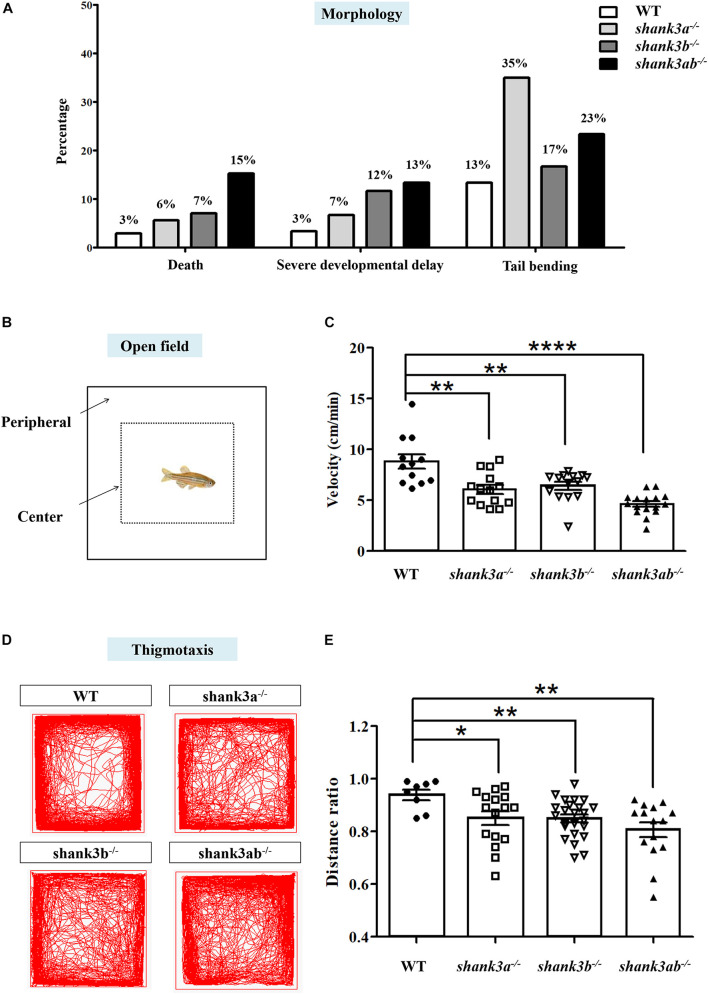
Morphological characteristics and locomotion activity alteration in shank3-deficient zebrafish. (A) Abnormal morphological changes in shank3a– /–, shank3b– /–, and shank3ab– /– larvae at ∼1 dpf, including death (WT, N = 340; shank3a– /–, N = 266; shank3b– /–, N = 270; shank3ab– /–, N = 118, severe developmental delay and tail bending (N = 60 each group). (B) Schematic diagram of the open field test and thigmotaxis test of adult male zebrafish (3.5 mpf). In the analysis of thigmotaxis test, the area of the peripheral zone is equal to the center zone (dotted line). (C) Compared with WT zebrafish (N = 12, 8.8 ± 2.4 cm/min), all shank3-deficient zebrafish displayed significantly decreased swimming velocity (shank3a– /–, N = 14, 6.1 ± 1.6 cm/min; shank3b– /–, N = 14, 6.4 ± 1.4 cm/min; shank3ab– /– zebrafish, N = 16, 4.6 ± 1.1 cm/min, respectively). (D) Representative traces of individual WT or shank3-deficient zebrafish in the thigmotaxis test. (E) Ratio for the distance traveled (periphery divided by the total zone) over 30 min in adult male zebrafish (3.5 mpf). WT, N = 8; shank3a– /–, N = 16; shank3b– /–, N = 24; shank3ab– /– zebrafish, N = 15. Data are shown as mean ± SEM; *P < 0.05, **P < 0.01, ***P < 0.001, ****P < 0.0001.

Acknowledgments
This image is the copyrighted work of the attributed author or publisher, and ZFIN has permission only to display this image to its users. Additional permissions should be obtained from the applicable author or publisher of the image. Full text @ Front. Neurosci.