IMAGE

Fig. 6

ID
ZDB-IMAGE-210927-10
Source
Figures for Sinclair et al., 2021
Image
Figure Caption

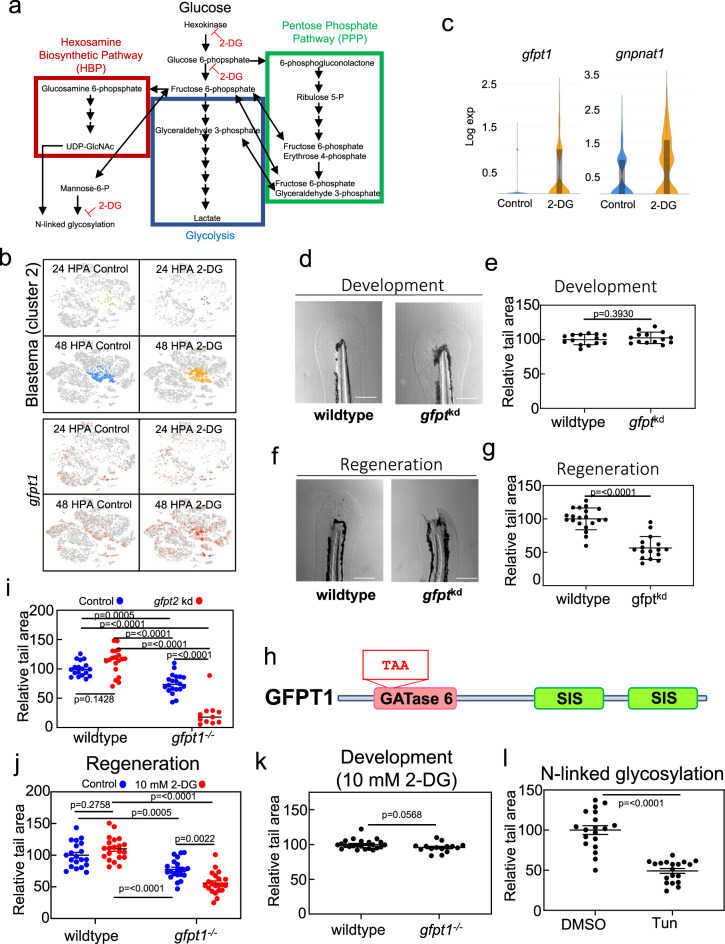
Fig. 6 The HBP and N-linked glycosylation trigger tail regeneration.

a Diagram depicting the HBP (red), glycolysis (blue), and the PPP (green). Single-head Arrows indicate pathway intermediates/products. Double-headed arrows indicate shared pathway substrates. Points where 2-DG acts as an inhibitor are indicated. b Expression of gfpt1 transposed onto the t-SNE plot of cells from the scRNA-seq, shown by library. c Violin plots of gfpt1 and gnpnat1 expression in control and 2-DG treated blastemas (cluster 2). d Image of the tail of 4 DPF embryos injected with Cas9 or Cas9 and gRNAs against gfpt1 and gfpt2 (gfptkd), set 1. Scale bar = 200 µm. e Quantification of tail area of 4 DPF embryos injected with Cas9 or Cas9 and gRNAs against gfpt1 and gfpt2 (gfptkd), set 1. Mean and SEM are shown. N = 14 embryos for control and 14 embryos for gfptkd. Statistics were determined an unpaired two-tailed t-test. f Image of 7 DPF embryo tails, 96 HPA, injected with Cas9 or Cas9 and gRNAs against gfpt1 and gfpt2 (gfptkd), set 1. Scale bar = 200 µm. g Quantification of tail area of 7 DPF embryos, 96 HPA, injected with Cas9 or Cas9 and gRNAs against gfpt1 and gfpt2 (gfptkd), set 1. Mean and SEM are shown. N = 20 embryos for control and 16 embryos for gfptkd. Statistics were determined an unpaired two-tailed t-test. h Cartoon depicting glutamine amidotransferase (GATase) 6 and sugar isomerase (SIS) domains of GFPT1. TAA indicates a premature stop codon introduced by a 20 bp deletion in gfpt1. i Quantification of tail area of wild-type or gfpt1−/− 7 DPF embryos, 96 HPA, injected with Cas9 or Cas9 and gRNAs against gfpt2. Mean and SEM are shown. Mean and SEM are shown. N = 18, 19, 20, and 11 embryos for wild-type control, wild-type gfpt2kd, gfpt1/−, and gfpt1−/−; gfpt2kd groups. Statistics were determined with ordinary one-way ANOVA. j Quantification of tail area of 96 HPA wild-type or gfpt1−/− embryos with and without 10 mM 2-DG treatment. Mean and SEM are shown. N = 20–21 embryos for all conditions. Statistics were determined with two-way ANOVA. k Quantification of tail area of 4 DPF wild-type or gfpt1−/− embryos treated with 10 mM 2-DG. Mean and SEM are shown. N = 23 and wild-type embryos and 15 for gfpt1−/− embryos. Statistics were determined with an unpaired two-tailed t-test. l Quantification of tail area of 96 HPA embryos treated with DMSO or Tunicamycin. Drug was added to embryo media 2 h prior to amputations and washed out 24 HPA. Mean and SEM are shown. N = 19 for all conditions. Statistics were determined with an unpaired two-tailed t-test.

Acknowledgments
This image is the copyrighted work of the attributed author or publisher, and ZFIN has permission only to display this image to its users. Additional permissions should be obtained from the applicable author or publisher of the image. Full text @ NPJ Regen Med