
Image
|
Figure Caption
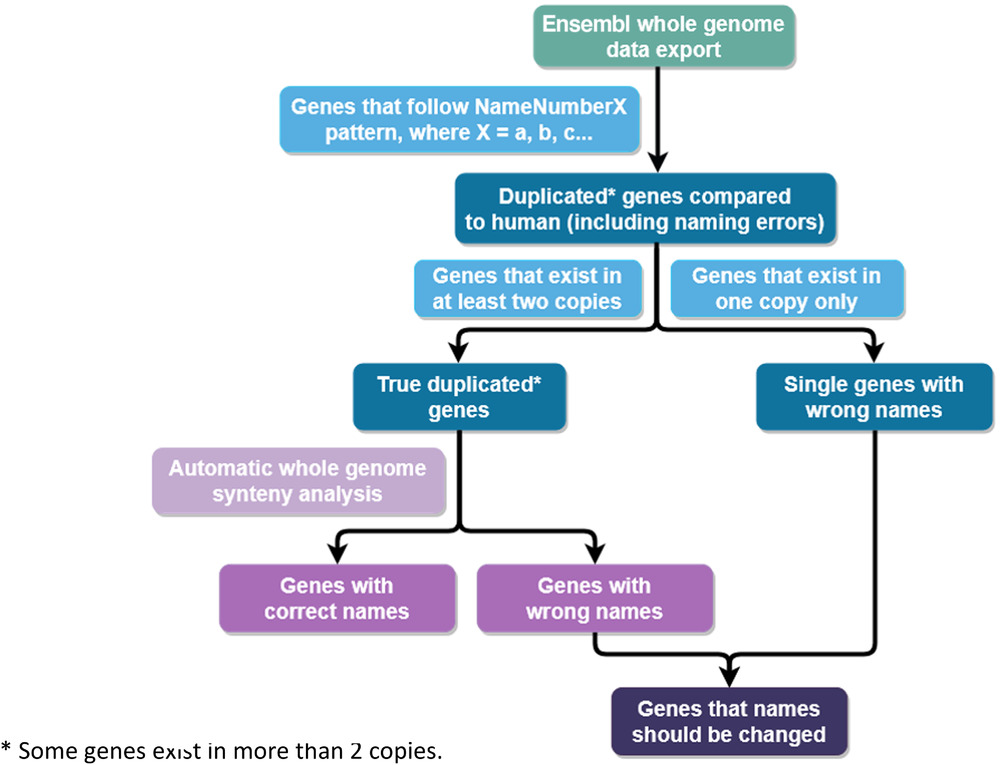
Fig. 2 Diagram of the data analysis workflow. Human, zebrafish, and spotted gar whole-genome databases were used for the analysis. All zebrafish and spotted gar genes that follow the NameNumberX pattern, where X = a, b, aa, bb, etc., were identified as duplicated genes. In this fraction, we identified single genes with wrong names and truly duplicated genes. For truly duplicated genes, we applied automatic whole-genome synteny analysis, which generated a list of genes with correct and incorrect names
Acknowledgments
This image is the copyrighted work of the attributed author or publisher, and
ZFIN has permission only to display this image to its users.
Additional permissions should be obtained from the applicable author or publisher of the image.
Full text @ Bioessays