IMAGE

Figure 3.

ID
ZDB-IMAGE-210922-29
Source
Figures for Katz et al., 2021
Image
Figure Caption

Figure 3. Quantification of silver-stained, X-ray microtomography (micro-CT)-scanned, and segmented larvae reveals wild-type melanin volume and content trends.

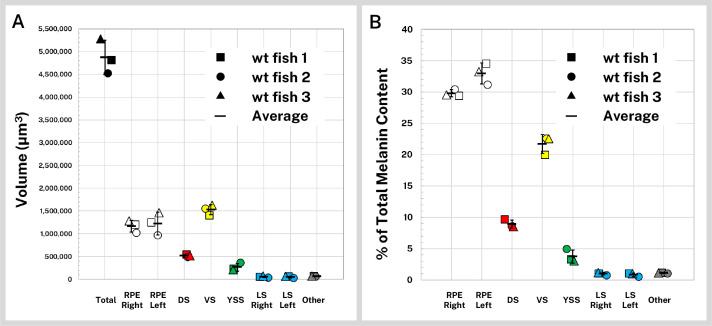
Wild-type (wt) 5 days post-fertilization (dpf) larvae (n = 3) were stained with silver and micro-CT imaged under the same conditions then segmented into major pigment regions as described in Figure 2: retinal pigment epithelium (RPE, right and left), dorsal stripe (DS), ventral stripe (VS), yolk sac stripe (YSS), lateral stripes (LS, right and left), and other melanin (other). (A) Volumes of the total pigmented regions and each segmented region are shown for the three fish. (B) Reconstructed stain intensity values are assumed to be proportional to melanin density; integrated intensity values for the segmented regions represents the melanin content of these regions. As proportions of total melanin content (summed across all segmented regions) the wt fish show high concordance between individual samples. Error bars = standard deviation from average.

Acknowledgments
This image is the copyrighted work of the attributed author or publisher, and ZFIN has permission only to display this image to its users. Additional permissions should be obtained from the applicable author or publisher of the image. Full text @ Elife