
|
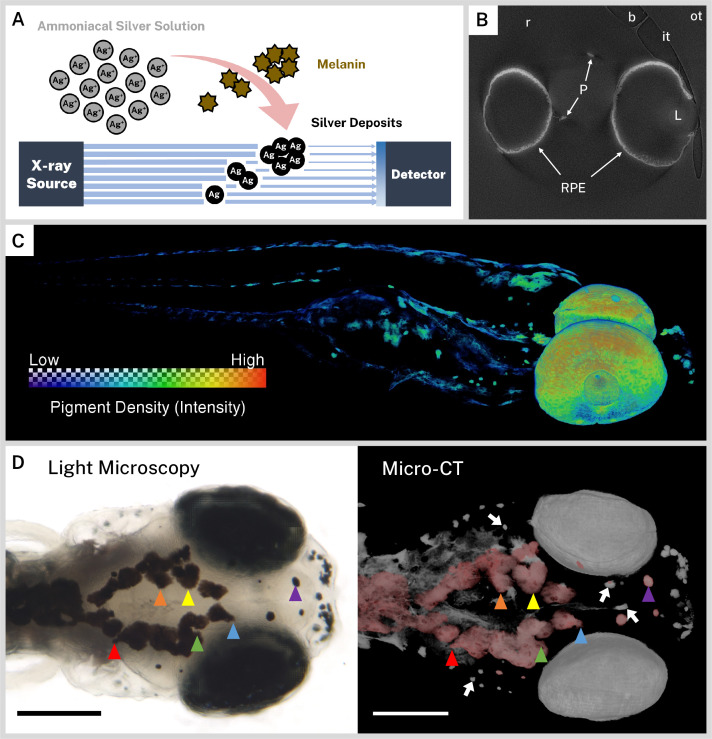
Figure 1
(A) Schematic overview of staining procedure. Ammoniacal silver solution reacts with endogenous melanin to deposit solid silver, which attenuates X-rays in micro-CT imaging. (B) A representative cropped and rotated slice of a micro-CT reconstruction of a 5 days post-fertilization (dpf) wild-type zebrafish stained with silver. RPE = retinal pigment epithelium, P = body pigment, L = lens, r = resin, it = inner wall of sample tube, ot = outer wall of sample tube, b = air bubble. (C) 3D rendering of a 5 dpf wild-type zebrafish stained with silver with a heatmap to illustrate pigment density throughout the fish. (D) Corresponding light microscopy (left) and micro-CT (right) images exhibit the same pigmentation patterns. In the micro-CT image, a top-down 3D rendering of stained melanin is shown in grayscale with the dorsal-most melanin digitally colored red to aid comparison with the light micrograph. Some distinguishing shared features are highlighted with colored arrowheads. White arrows indicate deeper melanin obscured by soft tissue in the light micrograph that can be visualized by targeted 3D re-rendering. Scale bars = 200 µm. Unstained samples do not exhibit melanin-related attenuation (Figure 1—figure supplement 1).
Ionic silver stains reproduce three-dimensional (3D) pigmentation patterns in X-ray microtomography (micro-CT) images.