IMAGE

Figure 7

ID
ZDB-IMAGE-210919-29
Source
Figures for Qi et al., 2021
Image
Figure Caption

Figure 7

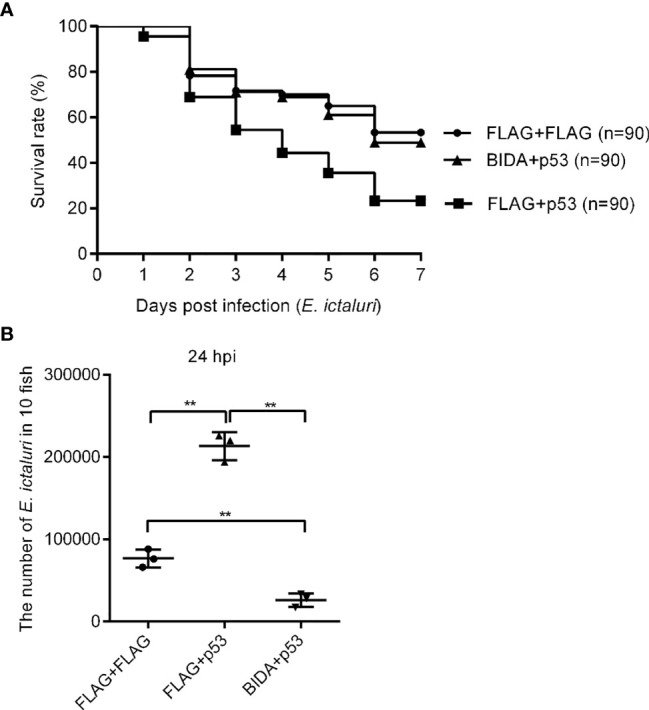
The effects of Bid and p53 on fish survival (A) and the number of E. ictaluri in larvae (B). For fish survival analysis, the fertilized eggs were microinjected with p3×FLAG empty plasmid, p53-Flag, or co-microinjected p53-Flag and bid-Flag and raised to 4 dpf, and then infected with E. ictaluri for 6 days. The numbers of surviving larvae were counted daily, and survival curves were generated. The number of E. ictaluri in larvae was calculated as the in vivo bacterial invasion assays. **p < 0.01.

Acknowledgments
This image is the copyrighted work of the attributed author or publisher, and ZFIN has permission only to display this image to its users. Additional permissions should be obtained from the applicable author or publisher of the image. Full text @ Front Immunol