
Image
|
Figure Caption
Figure 10
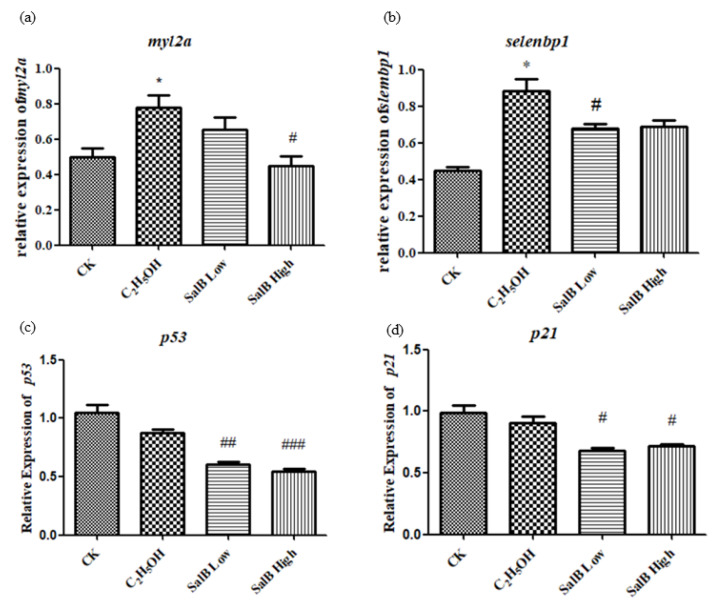
The expression of myl2a (a), selenbp1 (b), p53 (c) and p21 (d) after Sal B added in the group of ethanol acute toxicity treatment. The statistical results shown represent the means (n = 3); vs. the control group (n = 3) * p < 0.05, ** p < 0.01, *** p < 0.001 vs. the ethanol-treated group (n = 3) # p < 0.05, ## p < 0.01, ### p < 0.001.
Acknowledgments
This image is the copyrighted work of the attributed author or publisher, and
ZFIN has permission only to display this image to its users.
Additional permissions should be obtained from the applicable author or publisher of the image.
Full text @ Molecules