
Image
|
Figure Caption
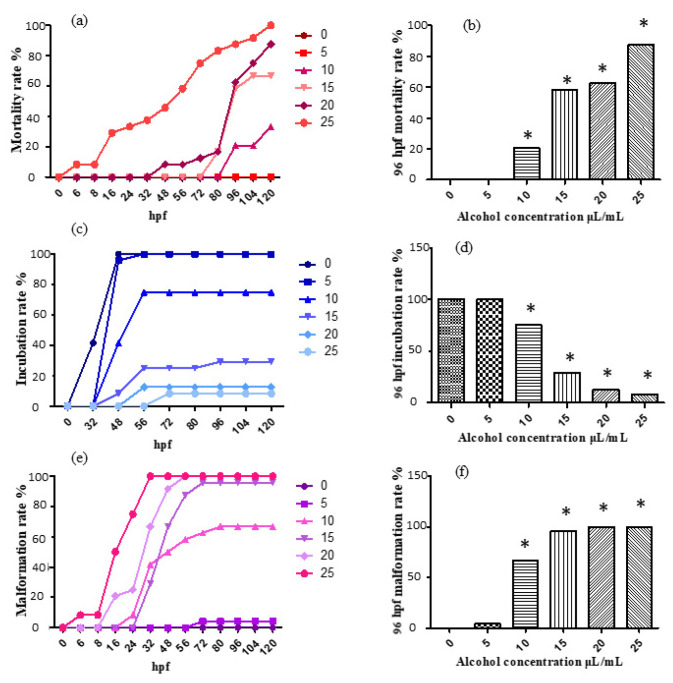
Figure 1
The mortality rate, incubation rate and malformation rate after ethanol treatment. The results were analyzed by χ2 test, vs. the control group (0 μL/mL ethanol): * p < 0.05. (a) mortality rate; (b) mortality rate at 96 hpf; (c) incubation rate; (d) incubation rate at 96 hpf; (e) malformation rate; (f) malformation rate at 96 hpf.
Acknowledgments
This image is the copyrighted work of the attributed author or publisher, and
ZFIN has permission only to display this image to its users.
Additional permissions should be obtained from the applicable author or publisher of the image.
Full text @ Molecules