IMAGE

FIGURE 3

ID
ZDB-IMAGE-210915-12
Source
Figures for Kalyn et al., 2021
Image
Figure Caption

FIGURE 3

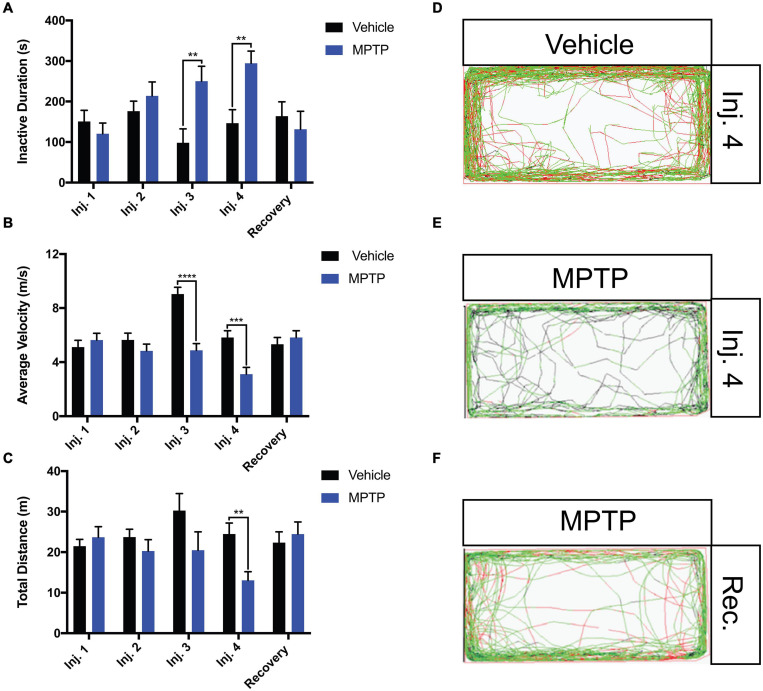
Impact of MPTP on adult zebrafish swimming behavior. Fish were acclimated to the apparatus for 15 min prior to behavioral analyses. Seven-minutes trials were performed. (A–C) Analysis of inactive durations (proxy for freezing bouts), average velocity and total distance for MPTP injected zebrafish and vehicle controls. Respective path images are as follows; injection 4 vehicle control (D), injection 4 MPTP (E), and 2-week recovered MPTP treated zebrafish (F). Red lines represent fast movement, green lines represent slow movement and black lines represent inactive movement below the slow threshold (n = 10 for all groups). Bars represent the mean ± the SEM. **p < 0.01, ***p < 0.001, and ****p < 0.0001.

Acknowledgments
This image is the copyrighted work of the attributed author or publisher, and ZFIN has permission only to display this image to its users. Additional permissions should be obtained from the applicable author or publisher of the image. Full text @ Front. Neurosci.