IMAGE

FIGURE 2

ID
ZDB-IMAGE-210915-11
Source
Figures for Kalyn et al., 2021
Image
Figure Caption

FIGURE 2

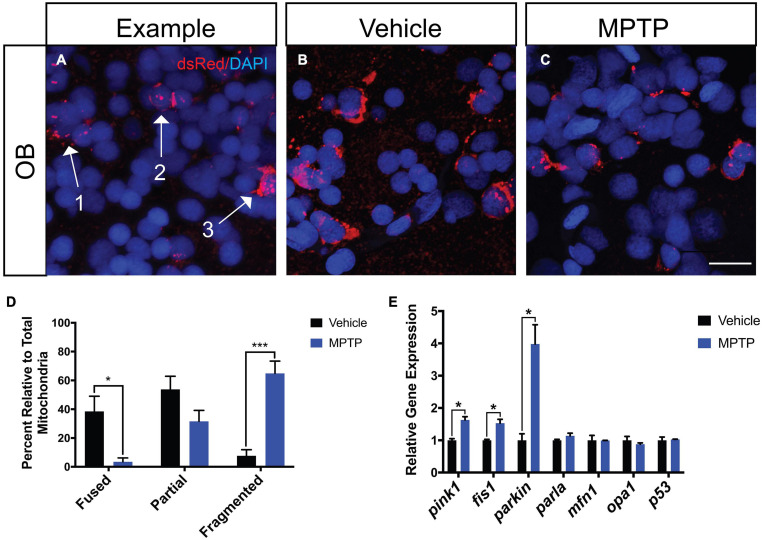
Effect of MPTP on mitochondrial fission-fusion dynamics in Tg(dat:tom20 MLS:mCherry) adult zebrafish. (A) Representative image depicting fragmented mitochondria (Arrow 1), partially fragmented mitochondria (Arrow 2), and fused mitochondria (Arrow 3). (B,C) Immunohistochemical labeling marked mCherry+ for mitochondrial visualization and nuclei with DAPI+ on coronal OB cryosections from vehicle and MPTP injected zebrafish. (D) Proportion of fused, partially fragmented and fragmented mitochondria (n = 4). (E) Whole brain qRT-PCR analysis for mitochondrial and apoptotic genes; mao-b, pink1, fis1, parkin, parla, mfn1, opa1, and p53 (n = 3 whole brains from each respective group). Scale bar = 10 μm. Bars represent the mean ± the SEM. *p < 0.05, ***p < 0.001.

Acknowledgments
This image is the copyrighted work of the attributed author or publisher, and ZFIN has permission only to display this image to its users. Additional permissions should be obtained from the applicable author or publisher of the image. Full text @ Front. Neurosci.