IMAGE

FIGURE 1

ID
ZDB-IMAGE-210915-10
Source
Figures for Kalyn et al., 2021
Image
Figure Caption

FIGURE 1

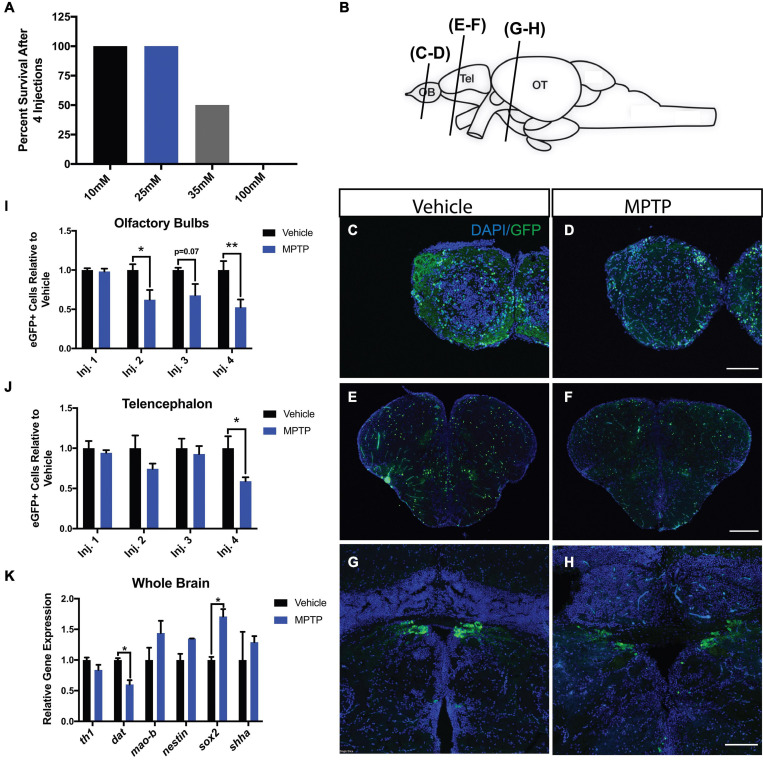
Impact of MPTP on various brain regions of adult Tg(dat:eGFP) zebrafish. (A) MPTP dose-response. (B) Schematic representation of the zebrafish brain with the planes of section indicated. Immunohistochemical labeling of eGFP (green) and DAPI (blue) to observe dopaminergic neurons in the olfactory bulbs (OBs) (C,D), telencephalon (E,F), and periventricular pretectal nucleus (PPv) (G,H). (I,J) Quantification of eGFP+ cells within the OBs and telencephalon respectively. (n = 6). (K) Whole brain qRT-PCR analysis for dopaminergic, and regeneration-related genes; th1, dat, sox2, nestin, and shha. (n = 3 whole brains from each respective group). Bars represent the mean ± the SEM. *p < 0.05, **p < 0.01. Scale bars = 100 and 200 μm for the OB/PPv and telencephalon respectively. OB, olfactory bulbs; Tel, telencephalon; OT, optic tectum.

Acknowledgments
This image is the copyrighted work of the attributed author or publisher, and ZFIN has permission only to display this image to its users. Additional permissions should be obtained from the applicable author or publisher of the image. Full text @ Front. Neurosci.