
|
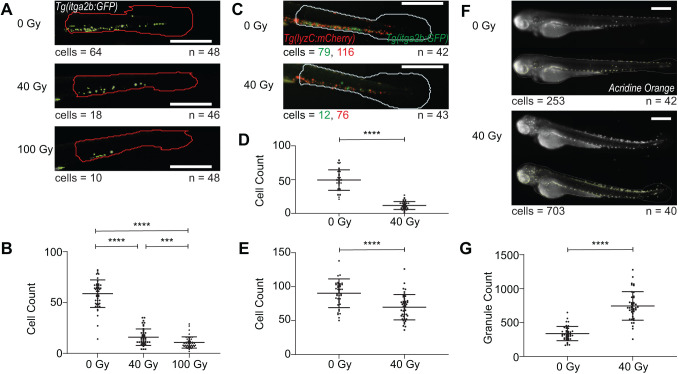
Fig. 3.
Automated analysis of the effects of X-ray irradiation on HSPC count and myeloid count in dual fluorophore images, as well as apoptosis in zebrafish embryos. (A) Fluorescent images of the tail of Tg(itga2b:GFP) embryos at 3 dpf, irradiated at 2 dpf with 0 Gy, 40 Gy or 100 Gy X-ray and analysed for HSPC count (green) in the tail region (red). (B) HSPC counts showing the reduction in HSPC number with 40 Gy (n=46) and 100 Gy (n=48) compared with 0 Gy (n=48). (C) Fluorescent images of the tail of Tg(itga2b:GFP)(lyzC:mcherry) dual fluorophore embryos at 3 dpf, irradiated at 2 dpf with 0 Gy or 40 Gy X-ray and analysed for HSPC (green) and myeloid (red) in the tail (white). (D,E) HSPC count of GFP-positive cells (D) and myeloid cell count of mCherry-positive cells (E) in the tail, showing the decrease in both cell types with irradiation (n=43) compared with unirradiated (n=42). (F) Fluorescent images of Acridine Orange-stained embryos at 3 dpf, irradiated at 2 dpf with 0 Gy or 40 Gy X-ray and analysed for granule count (green) in the whole fish. (G) Granule counts in the whole fish showing an increase in apoptosis following irradiation (n=40) compared with unirradiated (n=42). Irradiation experiments were performed in triplicate. Statistical analysis using unpaired t-tests. Error bars show mean±s.d. ***P<0.001, ****P<0.0001. Scale bars: 500 µm. n refers to the number of embryos analysed for each condition. Cell counts give the Athena cell count for the example image shown, for each cell type in dual fluorophore images.