IMAGE

Fig 2

ID
ZDB-IMAGE-210905-11
Source
Figures for Watterston et al., 2021
Image
Figure Caption

Fig 2 Loss of <italic toggle='yes'>sema3fb</italic> disrupts ISA migration.

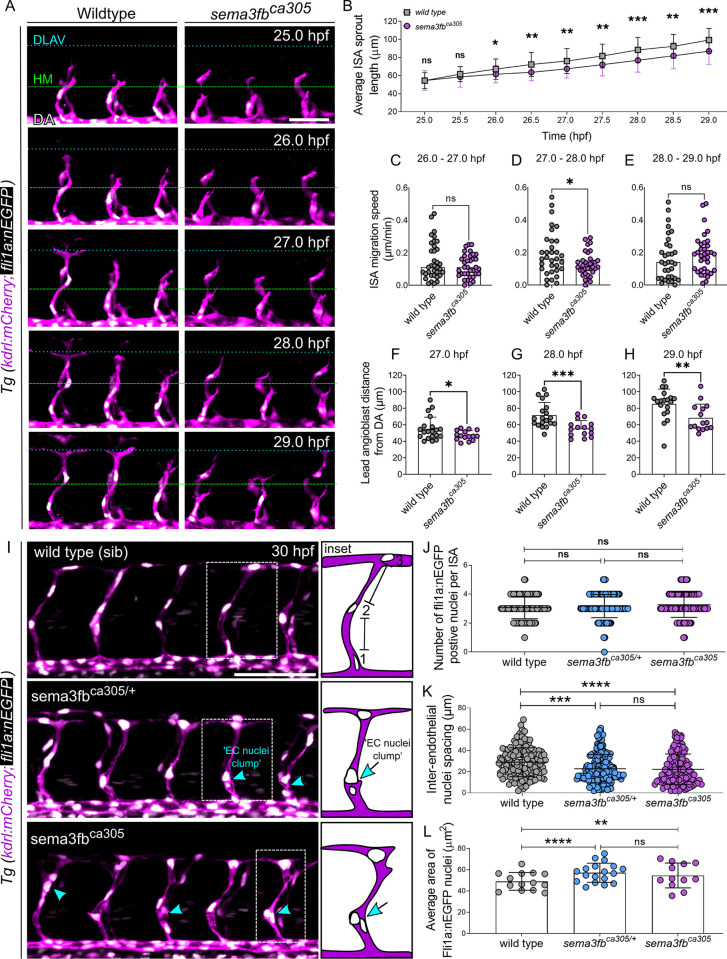
A) Lateral confocal time-lapse images from 25–29 hpf double transgenic Tg(kdrl:mCherry;fli1a:nEGFP) endothelial cells (magenta) and nuclei (white). The location of the horizontal myoseptum (green dashed line) and DLAV (blue dashed line) are noted to highlight ISA growth over time. Scale bar, 50 μm. B) Average ISA Sprout Length at 30-minute intervals from 25–29 hpf: WT vs sema3fbca305 at 25.0 hpf, p = 0.474; at 25.5 hpf p = 0.262; at 26.0 hpf p = 0.081; at 26.5 hpf *p = 0.023; at 27.0 hpf *p = 0.020; at 27.5 hpf **p = 0.030; at 28.0 hpf **p = 0.008; at 28.5 hpf **p = 0.007; at 29.0 hpf *p = 0.024. C-E) Quantification of ISA migration speeds (μm/min). C) At 26–27 hpf WT = 0.15 μm/min and sema3fbca305 = 0.12 μm/min, p = 0.157. D) At 27–28 hpf WT = 0.19 μm/min and sema3fbca305 = 0.13 μm/min, *p = 0.020. E) At 28–29 hpf: WT = 0.16 μm/min and sema3fbca305 = 0.19 μm/min, p = 0.461. B-E) N = 2; WT = 7 embryos (n = 33 ISAs) and sema3fbca305 = 7 embryos (n = 35 ISAs), Unpaired t-test with Welch’s correction. F-H) Lead angioblast distance from DA at 1hr intervals. F) At 27 hpf mean distance from DA: WT = 55.12±14.06 μm and sema3fbca305 = 47.18±5.75 μm, *p = 0.030. G) At 28 hpf mean distance from DA: WT = 71.57±15.47 μm and sema3fbca305 = 55.47±9.65 μm, ***p = 0.0008. H) At 29 hpf mean distance from DA: WT = 85.19±18.03 μm and sema3fbca305 = 68.36±16.64 μm, **p = 0.008. F-H) N = 1: WT = 4 embryos (20 ISAs) and sema3fbca305 = 3 embryos (15 ISAs), Unpaired t-test with Welch’s correction. I) Lateral confocal images of 30hpf double transgenic Tg(kdrl:mCherry;fli1a:nEGFP) endothelial cells (ECs, magenta) and nuclei (white). EC nuclei clumps (blue arrows/arrowheads) are noted. Scale bar, 100 μm. Inset: Schematics show method for measuring distance between EC nuclei and highlight EC nuclei clumps in ISAs. J) Number of EC nuclei (angioblasts) per ISAs at 30 hpf. WT (mean of 3 nuclei/ISA), heterozygous (het) sema3fbca305/+ (3 nuclei/ISA), and homozygous (hom) sema3fbca305 (3 nuclei/ISA). K) Quantification of inter-endothelial nuclei spacing per ISA at 30 hpf. WT (mean 28±13 μm), het sema3fbca305/+ (23±13μm), and hom sema3fbca305 (22±14 μm), ***p = 0.0002 and ****p<0.0001. L) Quantification of Average Area EC fli1a:nEGFP positive nuclei (angioblasts) per ISAs at 30 hpf. WT (mean 49±18 μm2), het sema3fbca305/+ (mean 60±24 μm2), and hom sema3fbca305 (mean 56±23 μm2),**p = 0.0069 and ****p<0.0001. I-L) N = 3; WT = 14 embryos (n = 138 ISAs), het sema3fbca305/+ = 19 embryos (n = 190 ISAs), and homsema3fbca305 = 11 embryos (n = 110 ISAs),. 2-Way ANOVA Tukey’s multiple comparisons test Error bars = ±SD.

Acknowledgments
This image is the copyrighted work of the attributed author or publisher, and ZFIN has permission only to display this image to its users. Additional permissions should be obtained from the applicable author or publisher of the image. Full text @ PLoS Genet.