
Image
|
Figure Caption
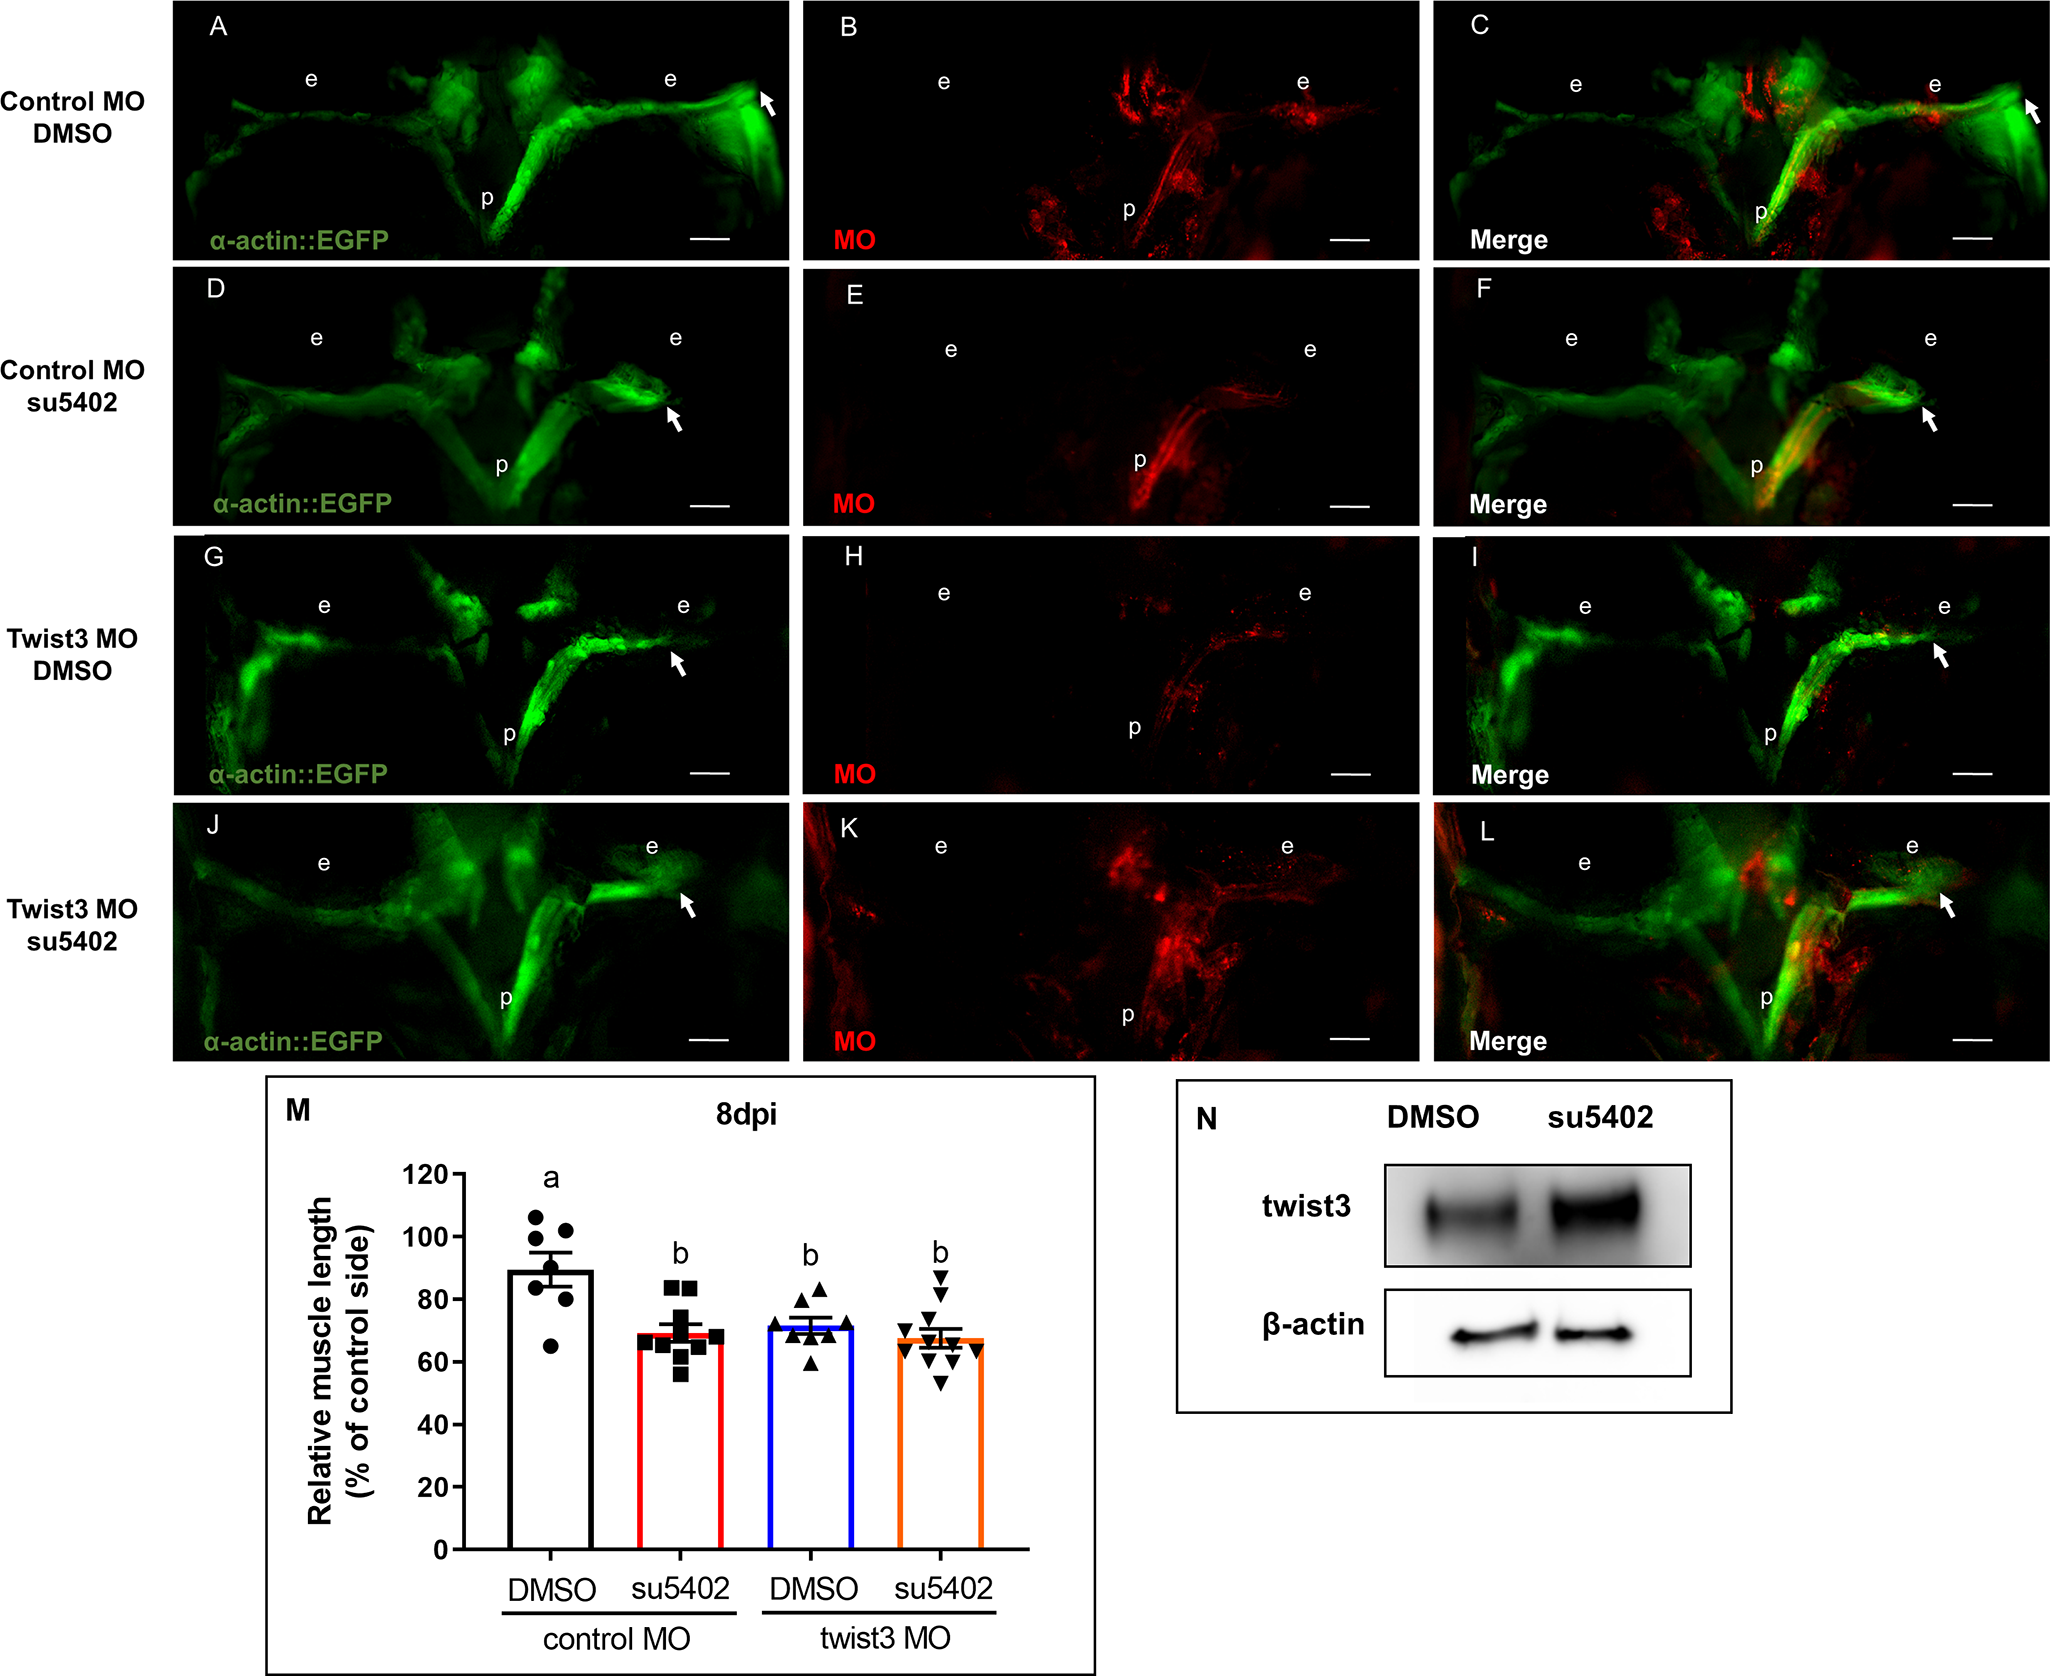
Fig. 4 Myectomized Tg(α-actin::EGFP) fish were treated with su5402 (D-F), or injected with twist3 MO (G-I), or treated with su5402 and injected with twist3 MO (J-L) compared with DMSO treatment and control MO injection (A-C). (M) All the experiment groups demonstrated significantly inhibited muscle regeneration, with no additive effect detected by combination of two treatments at 8 dpi. (p, pituitary; e, eye; Scale bar: 250μm, p<0.05 between two statistic groups a and b by ANOVA, control MO/DMSO: n = 7, control MO/su5402: n = 10, twist3 MO/DMSO: n = 8, twist3 MO/su5402: n = 11).
Figure Data
Acknowledgments
This image is the copyrighted work of the attributed author or publisher, and
ZFIN has permission only to display this image to its users.
Additional permissions should be obtained from the applicable author or publisher of the image.
Full text @ PLoS One