
|
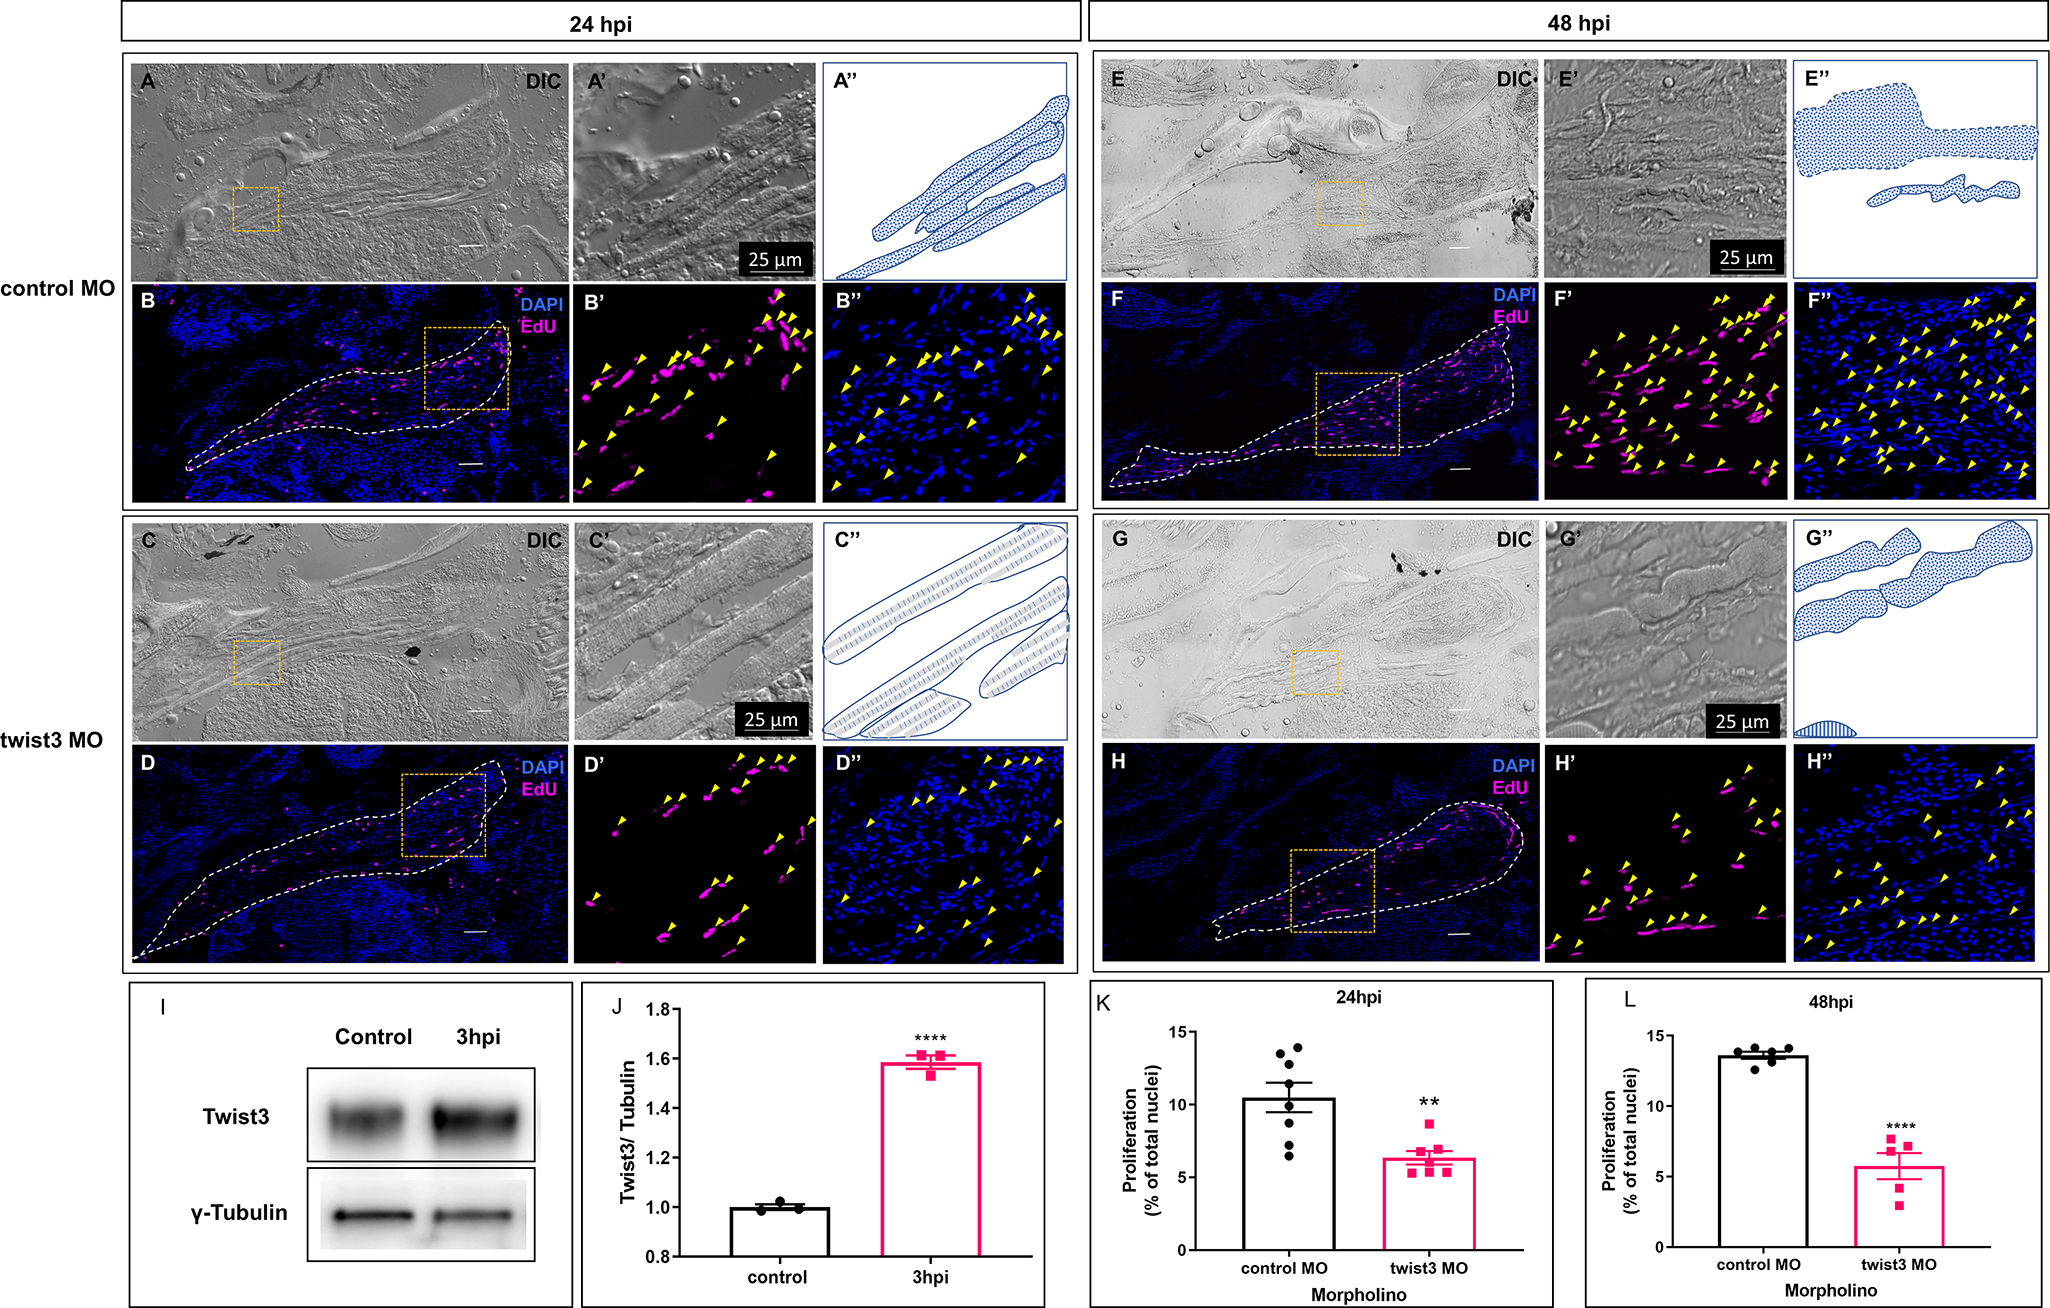
Fig. 3 The role of Twist3 in myocyte reprogramming and proliferation at 24 and 48 hpi was assessed by injecting Tg(α-actin::EGFP) fish with twist3 MO. Morphology of myocytes was shown using DIC images (A, C, E, G), highlighted in higher magnification (A’, C’, E’, G’) and illustrated in schematic diagram (A”, C”, E”, G”; solid line: outline of muscle; dash line” approximate outline of muscle; dotted pattern” mesenchyme-like myocytes; long light blue line: myofiber; short vertical strips: Z-band architecture). (B, D, F, H) Proliferating myoblasts were stained by EdU incorporation. EdU: magenta; DAPI: blue; Yellow arrows: positive Edu staining nuclei and corresponding DAPI channel. (I, J) Western blot analysis for Twist3 protein expression during EOM regeneration; values were averages ±SEM (t-test, p<0.0001 between control and 3hpi, n = 3). (K, L) Cell proliferation in injured muscle was significantly less in Twist3 MO injection group compared with control group at both 24 and 48 hpi. (24 hpi, control: n = 8, twist3 MO: n = 7; 48 hpi, control: n = 6, twist3 MO: n = 5) Scale bar: 50 μm, **p<0.01, ****p<0.0001.